
pyecharts
Python数据可视化库 支持多种图表类型和交互功能
pyecharts是基于Apache ECharts的Python数据可视化库。该库提供简洁API,支持30余种图表类型,兼容主流Notebook环境和Web框架。pyecharts配置灵活,文档详尽,对地理数据可视化支持强大。它支持链式调用,可生成静态HTML和动态图表,易于集成Flask等Web框架。提供400多个地图文件,支持百度地图,适合地理数据可视化。作为数据分析和可视化工具,pyecharts简单易用且功能丰富。


📣 简介
Apache ECharts 是一个由百度开源的数据可视化,凭借着良好的交互性,精巧的图表设计,得到了众多开发者的认可。而 Python 是一门富有表达力的语言,很适合用于数据处理。当数据分析遇上数据可视化时,pyecharts 诞生了。
✨ 特性
- 简洁的 API 设计,使用如丝滑般流畅,支持链式调用
- 囊括了 30+ 种常见图表,应有尽有
- 支持主流 Notebook 环境,Jupyter Notebook 和 JupyterLab
- 可轻松集成至 Flask,Sanic,Django 等主流 Web 框架
- 高度灵活的配置项,可轻松搭配出精美的图表
- 详细的文档和示例,帮助开发者更快的上手项目
- 多达 400+ 地图文件,并且支持原生百度地图,为地理数据可视化提供强有力的支持
⏳ 版本
v0.5.x 和 V1 间不兼容,V1 是一个全新的版本,详见 ISSUE#892,ISSUE#1033。
V0.5.x
支持 Python 2.7,3.4+
经开发团队决定,0.5.x 版本将不再进行维护,0.5.x 版本代码位于 05x 分支,文档位于 05x-docs.pyecharts.org。
V1
仅支持 Python 3.7+
新版本系列将从 v1.0.0 开始,文档位于 pyecharts.org;示例位于 gallery.pyecharts.org
V2
仅支持 Python 3.7+
新版本基于 Echarts 5.4.1+ 进行渲染, 文档和示例位置与 V1 相同
🔰 安装
pip 安装
# 安装 v1 以上版本
$ pip install pyecharts -U

# 如果需要安装 0.5.11 版本的开发者,可以使用
# pip install pyecharts==0.5.11
源码安装
# 安装 v1 以上版本
$ git clone https://github.com/pyecharts/pyecharts.git
# 如果需要安装 0.5.11 版本,请使用 git clone https://github.com/pyecharts/pyecharts.git -b v05x
$ cd pyecharts
$ pip install -r requirements.txt
$ python setup.py install
📝 使用
本地环境
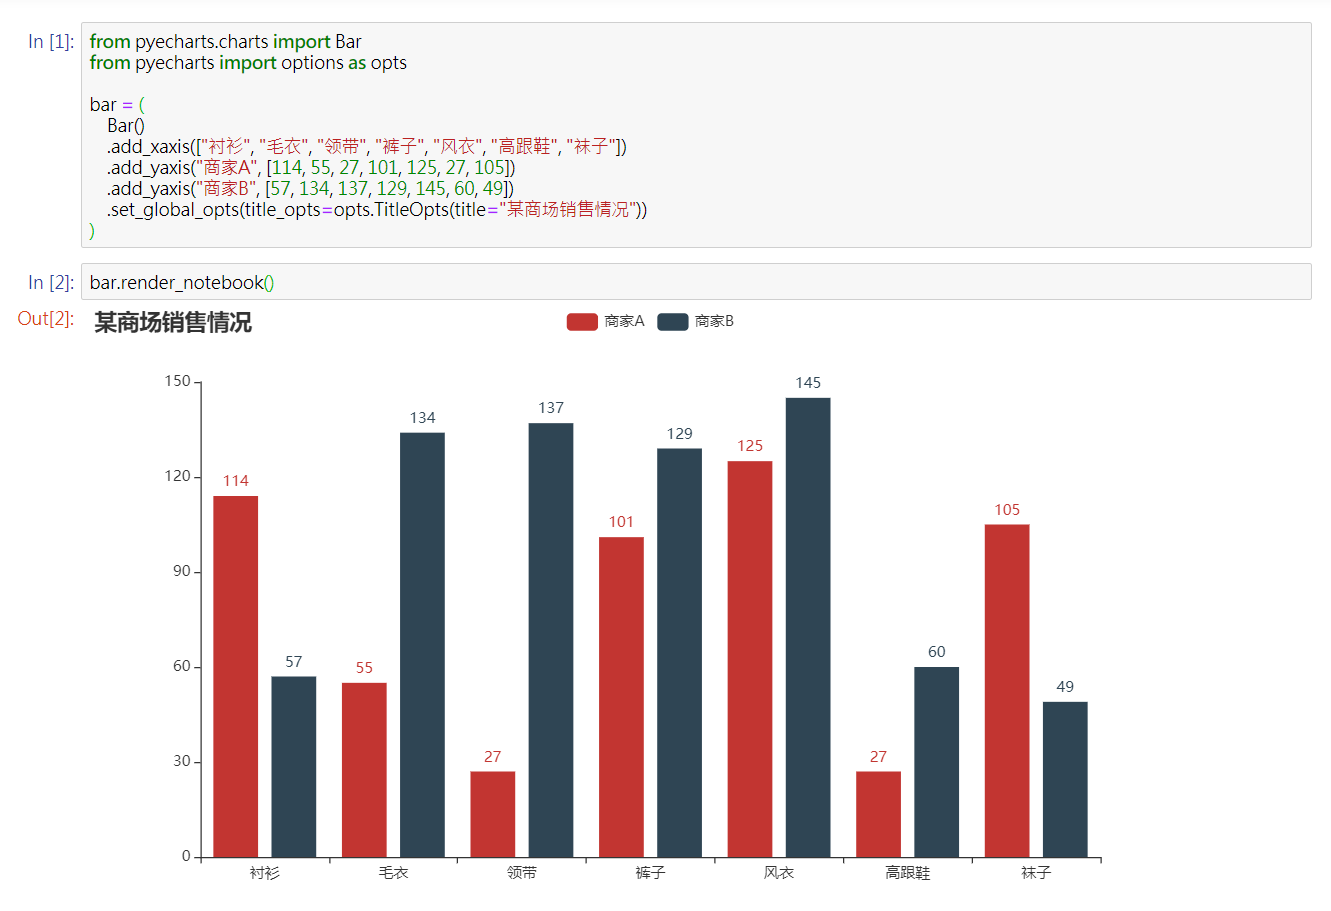
生成 HTML
<p align="center"> <img src="https://user-images.githubusercontent.com/19553554/55270272-d6ff1b80-52d7-11e9-820f-30660a068e3e.gif" width="85%" /> </p>from pyecharts.charts import Bar from pyecharts import options as opts # V1 版本开始支持链式调用 bar = ( Bar() .add_xaxis(["衬衫", "毛衣", "领带", "裤子", "风衣", "高跟鞋", "袜子"]) .add_yaxis("商家A", [114, 55, 27, 101, 125, 27, 105]) .add_yaxis("商家B", [57, 134, 137, 129, 145, 60, 49]) .set_global_opts(title_opts=opts.TitleOpts(title="某商场销售情况")) ) bar.render() # 不习惯链式调用的开发者依旧可以单独调用方法 bar = Bar() bar.add_xaxis(["衬衫", "毛衣", "领带", "裤子", "风衣", "高跟鞋", "袜子"]) bar.add_yaxis("商家A", [114, 55, 27, 101, 125, 27, 105]) bar.add_yaxis("商家B", [57, 134, 137, 129, 145, 60, 49]) bar.set_global_opts(title_opts=opts.TitleOpts(title="某商场销售情况")) bar.render()
生成图片
<p align="center"> <img src="https://user-images.githubusercontent.com/19553554/56089096-11fc7400-5ec0-11e9-9c21-551624036836.png" width="85%" /> </p>from snapshot_selenium import snapshot as driver from pyecharts import options as opts from pyecharts.charts import Bar from pyecharts.render import make_snapshot def bar_chart() -> Bar: c = ( Bar() .add_xaxis(["衬衫", "毛衣", "领带", "裤子", "风衣", "高跟鞋", "袜子"]) .add_yaxis("商家A", [114, 55, 27, 101, 125, 27, 105]) .add_yaxis("商家B", [57, 134, 137, 129, 145, 60, 49]) .reversal_axis() .set_series_opts(label_opts=opts.LabelOpts(position="right")) .set_global_opts(title_opts=opts.TitleOpts(title="Bar-测试渲染图片")) ) return c # 需要安装 snapshot-selenium 或者 snapshot-phantomjs make_snapshot(driver, bar_chart().render(), "bar.png")
Notebook 环境
Jupyter Notebook
JupyterLab

Web 框架

🔖 Demo
<div align="center"> <img src="https://user-images.githubusercontent.com/19553554/52197440-843a5200-289a-11e9-8601-3ce8d945b04a.gif" width="33%" alt="bar"/> <img src="https://user-images.githubusercontent.com/19553554/52360729-ad640980-2a77-11e9-84e2-feff7e11aea5.gif" width="33%" alt="boxplot"/> <img src="https://user-images.githubusercontent.com/19553554/52535290-4b611800-2d87-11e9-8bf2-b43a54a3bda8.png" width="33%" alt="effectScatter"/> <img src="https://user-images.githubusercontent.com/19553554/52332816-ac5eb800-2a36-11e9-8227-3538976f447d.gif" width="33%" alt="funnel"/> <img src="https://user-images.githubusercontent.com/19553554/52332988-0b243180-2a37-11e9-9db8-eb6b8c86a0de.png" width="33%" alt="gague"/> <img src="https://user-images.githubusercontent.com/19553554/52344575-133f9980-2a56-11e9-93e0-568e484936ce.gif" width="33%" alt="geo"/> <img src="https://user-images.githubusercontent.com/19553554/35082102-fd8d884a-fc52-11e7-9e40-5f94098d4493.gif" width="33%" alt="geo"/> <img src="https://user-images.githubusercontent.com/19553554/52727805-f7f20280-2ff0-11e9-91ab-cd99848e3127.gif" width="33%" alt="graph"/> <img src="https://user-images.githubusercontent.com/19553554/52345115-6534ef00-2a57-11e9-80cd-9cbfed252139.gif" width="33%" alt="heatmap"/> <img src="https://user-images.githubusercontent.com/19553554/52345490-4a16af00-2a58-11e9-9b43-7bbc86aa05b6.gif" width="33%" alt="kline"/> <img src="https://user-images.githubusercontent.com/19553554/52346064-b7770f80-2a59-11e9-9e03-6dae3a8c637d.gif" width="33%" alt="line"/> <img src="https://user-images.githubusercontent.com/19553554/52347117-248ba480-2a5c-11e9-8402-5a94054dca50.gif" width="33%" alt="liquid"/> <img src="https://user-images.githubusercontent.com/19553554/52347915-0a52c600-2a5e-11e9-8039-41268238576c.gif" width="33%" alt="map"/> <img src="https://user-images.githubusercontent.com/19553554/57545910-431c7700-738e-11e9-896b-e071b55115c7.png" width="33%" alt="bmap"/> <img src="https://user-images.githubusercontent.com/19553554/52535013-e48e2f80-2d83-11e9-8886-ac0d2122d6af.png" width="33%" alt="parallel"/> <img src="https://user-images.githubusercontent.com/19553554/52348202-bb596080-2a5e-11e9-84a7-60732be0743a.gif" width="33%" alt="pie"/> <img src="https://user-images.githubusercontent.com/19553554/35090457-afc0658e-fc74-11e7-9c58-24c780436287.gif" width="33%" alt="ploar"/> <img src="https://user-images.githubusercontent.com/19553554/52533994-932b7380-2d76-11e9-93b4-0de3132eb941.gif" width="33%" alt="radar"/> <img src="https://user-images.githubusercontent.com/19553554/52348431-420e3d80-2a5f-11e9-8cab-7b415592dc77.gif" width="33%" alt="scatter"/> <img src="https://user-images.githubusercontent.com/19553554/44004598-5636d74e-9e97-11e8-8a5c-92de6278880d.gif" width="33%" alt="tree"/> <img src="https://user-images.githubusercontent.com/19553554/35082251-b9e23982-fc53-11e7-8341-e7da1842389f.gif" width="33%" alt="treemap"/> <img src="https://user-images.githubusercontent.com/19553554/52348737-01fb8a80-2a60-11e9-94ac-dacbd7b58811.png" width="33%" alt="wordCloud"/> <img src="https://user-images.githubusercontent.com/19553554/52433989-4f075b80-2b49-11e9-9979-ef32c2d17c96.gif" width="33%" alt="bar3D"/> <img src="https://user-images.githubusercontent.com/19553554/52464826-4baab900-2bb7-11e9-8299-776f5ee43670.gif" width="33%" alt="line3D"/> <img src="https://user-images.githubusercontent.com/19553554/52802261-8d0cfe00-30ba-11e9-8ae7-ae0773770a59.gif" width="33%" alt="sankey"/> <img src="https://user-images.githubusercontent.com/19553554/52464647-aee81b80-2bb6-11e9-864e-c544392e523a.gif" width="33%" alt="scatter3D"/> <img src="https://user-images.githubusercontent.com/19553554/52465183-a55fb300-2bb8-11e9-8c10-4519c4e3f758.gif" width="33%" alt="surface3D"/> <img src="https://user-images.githubusercontent.com/19553554/52798246-7ebae400-30b2-11e9-8489-6c10339c3429.gif" width="33%" alt="themeRiver"/> <img src="https://user-images.githubusercontent.com/17564655/57567164-bdd5a880-7407-11e9-8d19-9be2776c57fa.png" width="33%" alt="sunburst"/> <img src="https://user-images.githubusercontent.com/19553554/52349544-c2ce3900-2a61-11e9-82af-28aaaaae0d67.gif" width="33%" alt="overlap"/> <img src="https://user-images.githubusercontent.com/19553554/35089737-ccc1c01c-fc72-11e7-874d-8ba8b89572eb.png" width="33%" alt="grid"/> <img src="https://user-images.githubusercontent.com/19553554/56976071-b9f28c80-6ba4-11e9-8efd-603203c77619.png" width="33%" alt="grid"> <img src="https://user-images.githubusercontent.com/19553554/35082279-e111743c-fc53-11e7-9362-580160593715.gif" width="33%" alt="timeline"/> </div>Demo 代码位于 example 文件夹下,欢迎参考 pyecharts 画廊 pyecharts-gallery。
更多详细文档,请访问
⛏ 代码质量
单元测试
$ pip install -r test/requirements.txt
$ make
编辑推荐精选


Trae
字节跳动发布的AI编程神器IDE
Trae是一种自适应的集成开发环境(IDE),通过自动化和多元协作改变开发流程。利用Trae,团队能够更快速、精确地编写和部署代码,从而提高编程效率和项目交付速度。Trae具备上下文感知和代码自动完成功能,是提升开发效率的理想工具。


问小白
全能AI智能助手,随时解答生活与工作的多样问题
问小白,由元石科技研发的AI智能助手,快速准确地解答各种生活和工作问题,包括但不限于搜索、规划和社交互动,帮助用户在日常生活中提高效率,轻松管理个人事务。


Transly
实时语音翻译/同声传译工具
Transly是一个多场景的AI大语言模型驱动的同声传译、专业翻译助手,它拥有超精准的音频识别翻译能力,几乎零延迟的使用体验和支持多国语言可以让你带它走遍全球,无论你是留学生、商务人士、韩剧美剧爱好者,还是出国游玩、多国会议、跨国追星等等,都可以满足你所有需要同传的场景需求,线上线下通用,扫除语言障碍,让全世界的语言交流不再有国界。


讯飞智文
一键生成PPT和Word,让学习生活更轻松
讯飞智文是一个利用 AI 技术的项目,能够帮助用户生成 PPT 以及各类文档。无论是商业领域的市场分析报告、年度目标制定,还是学生群体的职业生涯规划、实习避坑指南,亦或是活动策划、旅游攻略等内容,它都能提供支持,帮助用户精准表达,轻松呈现各种信息。


讯飞星火
深度推理能力全新升级,全面对标OpenAI o1
科大讯飞的星火大模型,支持语言理解、知识问答和文本创作等多功能,适用于多种文件和业务场景,提升办公和日常生活的效率。讯飞星火是一个提供丰富智能服务的平台,涵盖科技资讯、图像创作、写作辅助、编程解答、科研文献解读等功能,能为不同需求的用户提供便捷高效的帮助,助力用户轻松获取信息、解决问题,满足多样化使用场景。


Spark-TTS
一种基于大语言模型的高效单流解耦语音令牌文本到语音合成模型
Spark-TTS 是一个基于 PyTorch 的开源文本到语音合成项目,由多个知名机构联合参与。该项目提供了高效的 LLM(大语言模型)驱动的语音合成方案,支持语音克隆和语音创建功能,可通过命令行界面(CLI)和 Web UI 两种方式使用。用户可以根据需求调整语音的性别、音高、速度等参数,生成高质量的语音。该项目适用于多种场景,如有声读物制作、智能语音助手开发等��。


咔片PPT
AI助力,做PPT更简单!
咔片是一款轻量化在线演示设计工具,借助 AI 技术,实现从内容生成到智能设计的一站式 PPT 制作服务。支持多种文档格式导入生成 PPT,提供海量模板、智能美化、素材替换等功能,适用于销售、教师、学生等各类人群,能高效制作出高品质 PPT,满足不同场景演示需求。


讯飞绘文
选题、配图、成文,一站式创作,让内容运营更高效
讯飞绘文,一个AI集成平台,支持写作、选题、配图、排版和发布。高效生成适用于各类媒体的定制内容,加速品牌传播,提升内容营销效果。


材料星
专业的AI公文写作平台,公文写作神器
AI 材料星,专业的 AI 公文写作辅助平台,为体制内工作人员提供高效的公文写作解决方案。拥有海量公文文库、9 大核心 AI 功能,支持 30 + 文稿类型生成,助力快速完成领导讲话、工作总结、述职报告等材料,提升办公效率,是体制打工人的得力写作神器。


openai-agents-python
OpenAI Agents SDK,助力开发者便捷使用 OpenAI 相关功能。
openai-agents-python 是 OpenAI 推出的一款强大 Python SDK,它为开发者提供了与 OpenAI 模型交互的高效工具,支持工具调用、结果处理、追踪等功能,涵盖多种应用场景,如研究助手、财务研究等,能显著提升开发效率,让开发者更轻松地利用 OpenAI 的技术优势。
推荐工具精选


AI云服务特惠
懂AI专属折扣关注微信公众号
最新AI工具、AI资讯
独家AI资源、AI项目落地

微信扫一扫关注公众号