
netshoot
集成多种网络故障排查工具的容器镜像
netshoot 是一个集成多种网络故障排查工具的容器镜��像,适用于 Docker 和 Kubernetes 环境。它支持进入其他容器或主机的网络命名空间进行调试,内置 tcpdump、iperf、nmap 等常用工具。netshoot 提供了多个实际使用案例,可用于诊断各类容器网络问题。


netshoot: a Docker + Kubernetes network trouble-shooting swiss-army container
                    dP            dP                           dP
                    88            88                           88
88d888b. .d8888b. d8888P .d8888b. 88d888b. .d8888b. .d8888b. d8888P
88'  `88 88ooood8   88   Y8ooooo. 88'  `88 88'  `88 88'  `88   88
88    88 88.  ...   88         88 88    88 88.  .88 88.  .88   88
dP    dP `88888P'   dP   `88888P' dP    dP `88888P' `88888P'   dP
Purpose: Docker and Kubernetes network troubleshooting can become complex. With proper understanding of how Docker and Kubernetes networking works and the right set of tools, you can troubleshoot and resolve these networking issues. The netshoot container has a set of powerful networking troubleshooting tools that can be used to troubleshoot Docker networking issues. Along with these tools come a set of use-cases that show how this container can be used in real-world scenarios.
Network Namespaces: Before starting to use this tool, it's important to go over one key topic: Network Namespaces. Network namespaces provide isolation of the system resources associated with networking. Docker uses network and other type of namespaces (pid,mount,user..etc) to create an isolated environment for each container. Everything from interfaces, routes, and IPs is completely isolated within the network namespace of the container.
Kubernetes also uses network namespaces. Kubelets creates a network namespace per pod where all containers in that pod share that same network namespace (eths,IP, tcp sockets...etc). This is a key difference between Docker containers and Kubernetes pods.
Cool thing about namespaces is that you can switch between them. You can enter a different container's network namespace, perform some troubleshooting on its network's stack with tools that aren't even installed on that container. Additionally, netshoot can be used to troubleshoot the host itself by using the host's network namespace. This allows you to perform any troubleshooting without installing any new packages directly on the host or your application's package.
Netshoot with Docker
-
Container's Network Namespace: If you're having networking issues with your application's container, you can launch
netshootwith that container's network namespace like this:$ docker run -it --net container:<container_name> nicolaka/netshoot -
Host's Network Namespace: If you think the networking issue is on the host itself, you can launch
netshootwith that host's network namespace:$ docker run -it --net host nicolaka/netshoot -
Network's Network Namespace: If you want to troubleshoot a Docker network, you can enter the network's namespace using
nsenter. This is explained in thensentersection below.
Netshoot with Docker Compose
You can easily deploy netshoot using Docker Compose using something like this:
version: "3.6"
services:
  tcpdump:
    image: nicolaka/netshoot
    depends_on:
      - nginx
    command: tcpdump -i eth0 -w /data/nginx.pcap
    network_mode: service:nginx
    volumes:
      - $PWD/data:/data

  nginx:
    image: nginx:alpine
    ports:
      - 80:80
Netshoot with Kubernetes
-
if you want to debug using an ephemeral container in an existing pod:
$ kubectl debug mypod -it --image=nicolaka/netshoot -
if you want to spin up a throw away pod for debugging.
$ kubectl run tmp-shell --rm -i --tty --image nicolaka/netshoot -
if you want to spin up a container on the host's network namespace.
$ kubectl run tmp-shell --rm -i --tty --overrides='{"spec": {"hostNetwork": true}}' --image nicolaka/netshoot -
if you want to use netshoot as a sidecar container to troubleshoot your application container
   $ cat netshoot-sidecar.yaml
   apiVersion: apps/v1
   kind: Deployment
   metadata:
       name: nginx-netshoot
       labels:
           app: nginx-netshoot
   spec:
   replicas: 1
   selector:
       matchLabels:
           app: nginx-netshoot
   template:
       metadata:
       labels:
           app: nginx-netshoot
       spec:
           containers:
           - name: nginx
           image: nginx:1.14.2
           ports:
               - containerPort: 80
           - name: netshoot
           image: nicolaka/netshoot
           command: ["/bin/bash"]
           args: ["-c", "while true; do ping localhost; sleep 60;done"]

   $ kubectl apply -f netshoot-sidecar.yaml
     deployment.apps/nginx-netshoot created

   $ kubectl get pod
NAME                              READY   STATUS    RESTARTS   AGE
nginx-netshoot-7f9c6957f8-kr8q6   2/2     Running   0          4m27s

   $ kubectl exec -it nginx-netshoot-7f9c6957f8-kr8q6 -c netshoot -- /bin/zsh
                       dP            dP                           dP
                       88            88                           88
   88d888b. .d8888b. d8888P .d8888b. 88d888b. .d8888b. .d8888b. d8888P
   88'  `88 88ooood8   88   Y8ooooo. 88'  `88 88'  `88 88'  `88   88
   88    88 88.  ...   88         88 88    88 88.  .88 88.  .88   88
   dP    dP `88888P'   dP   `88888P' dP    dP `88888P' `88888P'   dP

   Welcome to Netshoot! (github.com/nicolaka/netshoot)


   nginx-netshoot-7f9c6957f8-kr8q6 $
The netshoot kubectl plugin
To easily troubleshoot networking issues in your k8s environment, you can leverage the Netshoot Kubectl Plugin (shout out to Nebojsa Ilic for creating it!). Using this kubectl plugin, you can easily create ephemeral netshoot containers to troubleshoot existing pods, k8s controller or worker nodes. To install the plugin, follow these steps.
Sample Usage:
# spin up a throwaway pod for troubleshooting
kubectl netshoot run tmp-shell

# debug using an ephemeral container in an existing pod
kubectl netshoot debug my-existing-pod

# create a debug session on a node
kubectl netshoot debug node/my-node
Network Problems
Many network issues could result in application performance degradation. Some of those issues could be related to the underlying networking infrastructure(underlay). Others could be related to misconfiguration at the host or Docker level. Let's take a look at common networking issues:
- latency
- routing
- DNS resolution
- firewall
- incomplete ARPs
To troubleshoot these issues, netshoot includes a set of powerful tools as recommended by this diagram.

Included Packages: The following packages are included in netshoot. We'll go over some with some sample use-cases.
apache2-utils \
bash \
bind-tools \
bird \
bridge-utils \
busybox-extras \
conntrack-tools \
curl \
dhcping \
drill \
ethtool \
file\
fping \
grpcurl \
iftop \
iperf \
iperf3 \
iproute2 \
ipset \
iptables \
iptraf-ng \
iputils \
ipvsadm \
jq \
libc6-compat \
liboping \
ltrace \
mtr \
net-snmp-tools \
netcat-openbsd \
nftables \
ngrep \
nmap \
nmap-nping \
nmap-scripts \
openssl \
py3-pip \
py3-setuptools \
scapy \
socat \
speedtest-cli \
openssh \
strace \
tcpdump \
tcptraceroute \
tshark \
util-linux \
vim \
git \
zsh \
websocat \
swaks \
perl-crypt-ssleay \
perl-net-ssleay
Sample Use-cases
iperf
Purpose: test networking performance between two containers/hosts.
Create Overlay network:
$ docker network create -d overlay perf-test
Launch two containers:
🐳 → docker service create --name perf-test-a --network perf-test nicolaka/netshoot iperf -s -p 9999
7dkcckjs0g7b4eddv8e5ez9nv
🐳 → docker service create --name perf-test-b --network perf-test nicolaka/netshoot iperf -c perf-test-a -p 9999
2yb6fxls5ezfnav2z93lua8xl
🐳 → docker service ls
ID NAME REPLICAS IMAGE COMMAND
2yb6fxls5ezf perf-test-b 1/1 nicolaka/netshoot iperf -c perf-test-a -p 9999
7dkcckjs0g7b perf-test-a 1/1 nicolaka/netshoot iperf -s -p 9999
🐳 → docker ps
CONTAINER ID IMAGE COMMAND CREATED STATUS PORTS NAMES
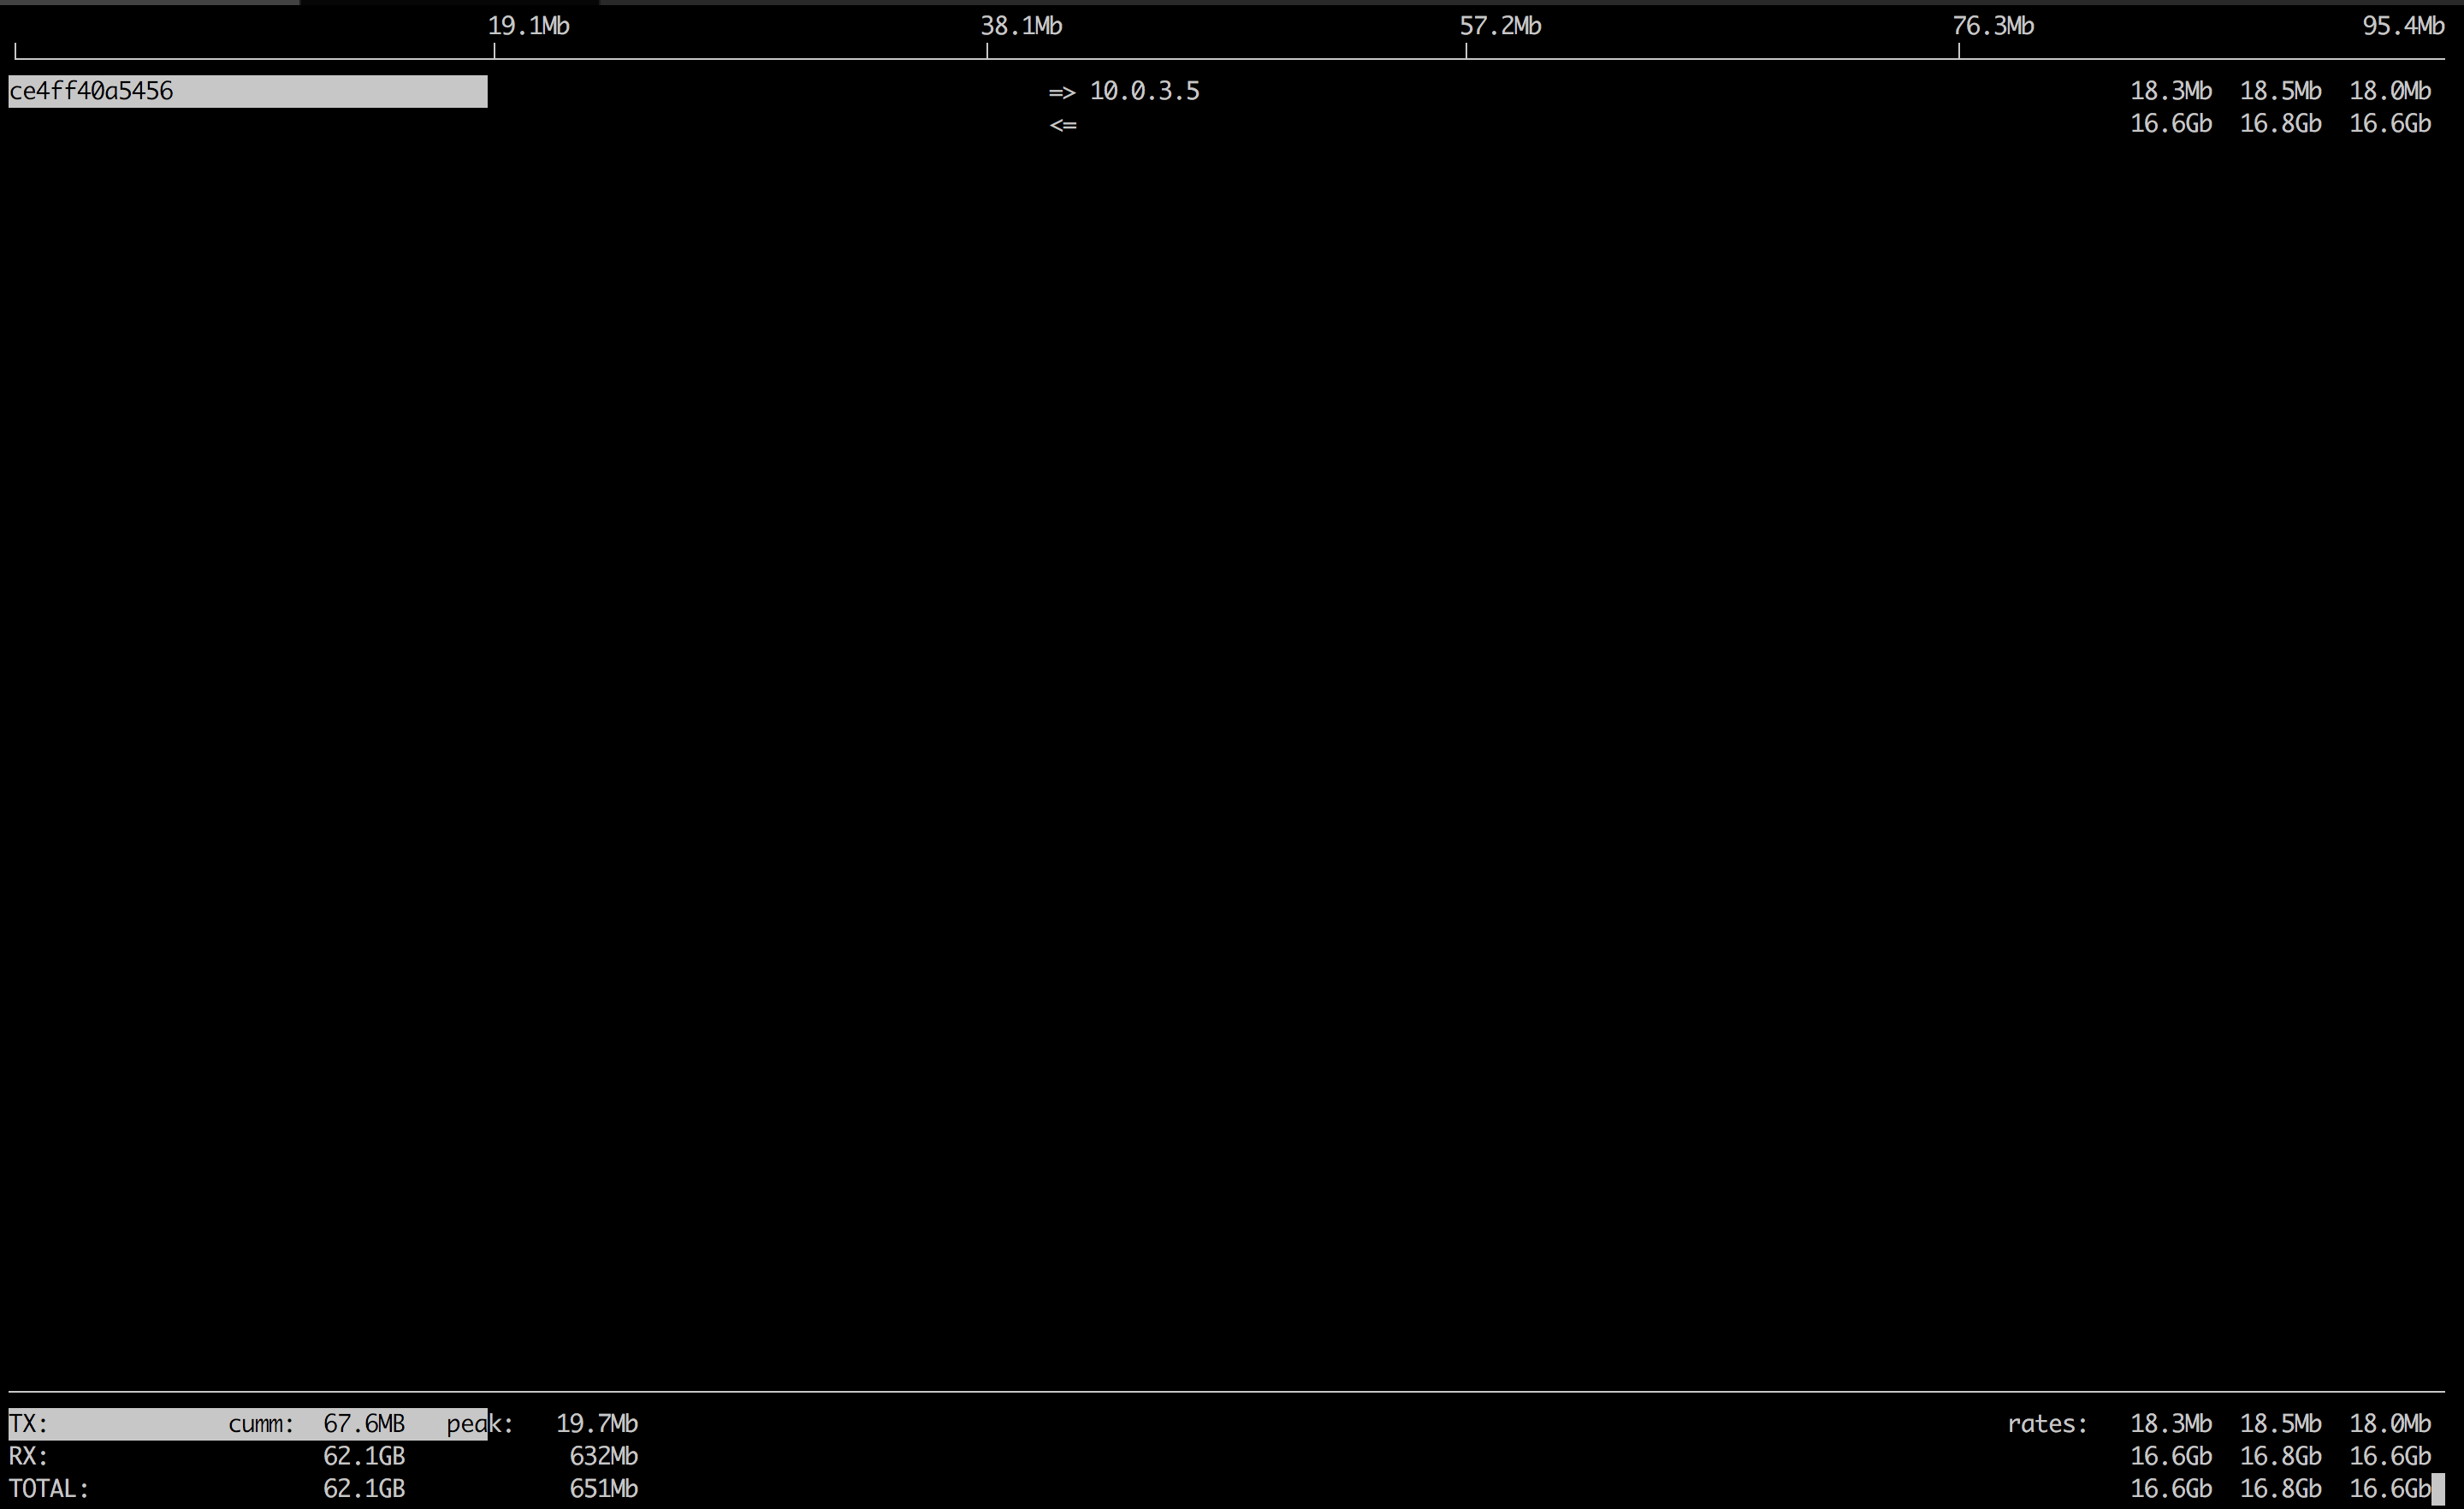
ce4ff40a5456 nicolaka/netshoot:latest "iperf -s -p 9999" 31 seconds ago Up 30 seconds perf-test-a.1.bil2mo8inj3r9nyrss1g15qav
🐳 → docker logs ce4ff40a5456
------------------------------------------------------------
Server listening on TCP port 9999
TCP window size: 85.3 KByte (default)
------------------------------------------------------------
[ 4] local 10.0.3.3 port 9999 connected with 10.0.3.5 port 35102
[ ID] Interval Transfer Bandwidth
[ 4] 0.0-10.0 sec 32.7 GBytes 28.1 Gbits/sec
[ 5] local 10.0.3.3 port 9999 connected with 10.0.3.5 port 35112
tcpdump
tcpdump is a powerful and common packet analyzer that runs under the command line. It allows the user to display TCP/IP and other packets being transmitted or received over an attached network interface.
# Continuing on the iperf example. Let's launch netshoot with perf-test-a's container network namespace.

🐳  → docker run -it --net container:perf-test-a.1.0qlf1kaka0cq38gojf7wcatoa  nicolaka/netshoot

# Capturing packets on eth0 and tcp port 9999.

/ # tcpdump -i eth0 port 9999 -c 1 -Xvv
tcpdump: listening on eth0, link-type EN10MB (Ethernet), capture size 262144 bytes
23:14:09.771825 IP (tos 0x0, ttl 64, id 60898, offset 0, flags [DF], proto TCP (6), length 64360)
    10.0.3.5.60032 > 0e2ccbf3d608.9999: Flags [.], cksum 0x1563 (incorrect -> 0x895d), seq 222376702:222441010, ack 3545090958, win 221, options [nop,nop,TS val 2488870 ecr 2488869], length 64308
	0x0000:  4500 fb68 ede2 4000 4006 37a5 0a00 0305  E..h..@.@.7.....
	0x0010:  0a00 0303 ea80 270f 0d41 32fe d34d cb8e  ......'..A2..M..
	0x0020:  8010 00dd 1563 0000 0101 080a 0025 fa26  .....c.......%.&
	0x0030:  0025 fa25 0000 0000 0000 0001 0000 270f  .%.%..........'.
	0x0040:  0000 0000 0000 0000 ffff d8f0 3435 3637  ............4567
	0x0050:  3839 3031 3233 3435 3637 3839 3031 3233  8901234567890123
	0x0060:  3435 3637 3839 3031 3233 3435 3637 3839  4567890123456789
	0x0070:  3031 3233 3435 3637 3839 3031 3233 3435  0123456789012345
	0x0080:  3637 3839 3031 3233 3435 3637 3839 3031  6789012345678901
	0x0090:  3233 3435 3637 3839 3031 3233 3435 3637  2345678901234567
	0x00a0:  3839 3031 3233 3435 3637 3839 3031 3233  8901234567890123
	0x00b0:  3435 3637 3839 3031 3233 3435 3637 3839  4567890123456789
	0x00c0:  3031 3233 3435 3637 3839 3031 3233 3435  0123456789012345
	0x00d0:  3637 3839 3031 3233 3435 3637 3839 3031  6789012345678901
	0x00e0:  3233 3435 3637 3839 3031 3233 3435 3637  2345678901234567
	0x00f0:  3839 3031 3233 3435 3637 3839 3031 3233  8901234567890123
	0x0100:  3435 3637 3839 3031 3233 3435 3637 3839  4567890123456789
More info on tcpdump can be found here.
netstat
Purpose: netstat is a useful tool for checking your network configuration and activity.
Continuing on from iperf example. Let's use netstat to confirm that it's listening on port 9999.
🐳  → docker run -it --net container:perf-test-a.1.0qlf1kaka0cq38gojf7wcatoa  nicolaka/netshoot

/ # netstat -tulpn
Active Internet connections (only servers)
Proto Recv-Q Send-Q Local Address           Foreign Address         State       PID/Program name
tcp        0      0 127.0.0.11:46727        0.0.0.0:*               LISTEN      -
tcp        0      0 0.0.0.0:9999            0.0.0.0:*               LISTEN      -
udp        0      0 127.0.0.11:39552        0.0.0.0:*                           -
nmap
nmap ("Network Mapper") is an open source tool for network exploration and security auditing. It is very useful for scanning to see which ports are open between a given set of hosts. This is a common thing to check for when installing Swarm or UCP because a range of ports is required for cluster communication. The command analyzes the connection pathway between the host where nmap is running and the given target address.
🐳  → docker run -it --privileged nicolaka/netshoot nmap -p 12376-12390 -dd 172.31.24.25

...
Discovered closed port 12388/tcp on 172.31.24.25
Discovered closed port 12379/tcp on 172.31.24.25
Discovered closed port 12389/tcp on 172.31.24.25
Discovered closed port 12376/tcp on 172.31.24.25
...
There are several states that ports will be discovered as:
open: the pathway to the port is open and there is an application listening on this port.closed: the pathway to the port is open but there is no application listening on this port.filtered: the pathway to the port is closed, blocked by a firewall, routing rules, or host-based rules.
iftop
Purpose: iftop does for network usage what top does for CPU usage. It listens to network traffic on a named interface and displays a table of current bandwidth usage by pairs of hosts.
Continuing the iperf example.
 → docker ps
CONTAINER ID        IMAGE                      COMMAND                  CREATED             STATUS              PORTS               NAMES
ce4ff40a5456        nicolaka/netshoot:latest   "iperf -s -p 9999"       5 minutes ago       Up 5 minutes                            perf-test-a.1.bil2mo8inj3r9nyrss1g15qav

🐳  → docker run -it --net container:perf-test-a.1.bil2mo8inj3r9nyrss1g15qav nicolaka/netshoot iftop -i eth0
drill
Purpose: drill is a tool to designed to get all sorts of information out of the DNS.
Continuing the iperf example, we'll use drill to understand how services' DNS is resolved in Docker.
🐳  → docker run -it --net container:perf-test-a.1.bil2mo8inj3r9nyrss1g15qav nicolaka/netshoot drill -V 5 perf-test-b
;; ->>HEADER<<- opcode: QUERY, rcode: NOERROR, id: 0
;; flags: rd ; QUERY: 1, ANSWER: 0, AUTHORITY: 0, ADDITIONAL: 0
;; QUESTION SECTION:
;; perf-test-b.	IN	A

;; ANSWER SECTION:

;; AUTHORITY SECTION:

;; ADDITIONAL SECTION:

;; Query time: 0 msec
;; WHEN: Thu Aug 18 02:08:47 2016
;; MSG SIZE  rcvd: 0
;; ->>HEADER<<- opcode: QUERY, rcode: NOERROR, id: 52723
;; flags: qr rd ra ; QUERY: 1, ANSWER: 1, AUTHORITY: 0, ADDITIONAL: 0
;; QUESTION SECTION:
;; perf-test-b.	IN	A

;; ANSWER SECTION:
perf-test-b.	600	IN	A	10.0.3.4 <<<<<<<<<<<<<<<<<<<<<<<<<< Service VIP

;; AUTHORITY SECTION:

;; ADDITIONAL SECTION:

;; Query time: 1 msec
;; SERVER: 127.0.0.11 <<<<<<<<<<<<<<<<<<<<<<<<<<<<<<<<<<<<< Local resolver
;; WHEN: Thu Aug 18 02:08:47 2016
;; MSG SIZE  rcvd: 56
netcat
Purpose: a simple Unix utility that reads and writes data across network connections, using the TCP or UDP protocol. It's useful for testing and troubleshooting TCP/UDP connections. netcat can be used to detect if there's a firewall rule blocking certain ports.
🐳  →  docker network create -d overlay my-ovl
55rohpeerwqx8og4n0byr0ehu

🐳  → docker service create --name service-a --network my-ovl -p 8080:8080 nicolaka/netshoot nc -l 8080
bnj517hh4ylpf7ewawsp9unrc

🐳  → docker service create --name service-b --network my-ovl nicolaka/netshoot nc -vz service-a 8080
3xv1ukbd3kr03j4uybmmlp27j

🐳  → docker logs service-b.1.0c5wy4104aosovtl1z9oixiso
Connection to service-a 8080 port [tcp/http-alt] succeeded!
netgen
Purpose: netgen is a simple [script](https://github.com/nicolaka/netshoot/blob/master/netgen.sh that will generate a packet of data between containers periodically using netcat. The generated traffic can be used to demonstrate different features of the networking stack.
netgen <host> <ip> will create a netcat server and client listening and sending to the same port.
Using netgen with docker run:
🐳  →  docker network create -d bridge br
01b167971453700cf0a40d7e1a0dc2b0021e024bbb119541cc8c1858343c9cfc

🐳  →  docker run -d --rm --net br --name c1 nicolaka/netshoot netgen c2 5000
8c51eb2100c35d14244dcecb80839c780999159985415a684258c7154ec6bd42

🐳  →  docker run -it --rm --net br --name c2 nicolaka/netshoot netgen c1 5000
Listener started on port 5000
Sending traffic to c1 on port 5000 every 10 seconds
Sent 1 messages to c1:5000
Sent 2 messages to c1:5000

🐳  →  sudo tcpdump -vvvn -i eth0 port 5000
...
Using netgen with docker services:
🐳  →  docker network create -d overlay ov
01b167971453700cf0a40d7e1a0dc2b0021e024bbb119541cc8c1858343c9cfc

🐳  →  docker service create --network ov --replicas 3 --name srvc netshoot netgen srvc 5000
y93t8mb9wgzsc27f7l2rdu5io

🐳  →  docker service logs srvc
srvc.1.vwklts5ybq5w@moby    | Listener started on port 5000
srvc.1.vwklts5ybq5w@moby    | Sending traffic to srvc on port 5000 every 10 seconds
srvc.1.vwklts5ybq5w@moby    | Sent 1 messages to srvc:5000
srvc.3.dv4er00inlxo@moby    | Listener started on port 5000
srvc.2.vu47gf0sdmje@moby    | Listener started on port 5000
...


🐳  →  sudo tcpdump -vvvn -i eth0 port 5000
...
iproute2
purpose: a collection of utilities for controlling TCP / IP networking and traffic control in Linux.
# Sample routing and arp table of the docker host.

🐳  → docker run -it --net host nicolaka/netshoot

/ # ip route show
default via 192.168.65.1 dev eth0  metric 204
172.17.0.0/16 dev docker0  proto kernel  scope link  src 172.17.0.1
172.19.0.0/16 dev br-fd694678f5c3  proto kernel  scope link  src 172.19.0.1 linkdown
172.20.0.0/16 dev docker_gwbridge  proto kernel  scope link  src 172.20.0.1
172.21.0.0/16 dev br-0d73cc4ac114  proto kernel  scope link  src 172.21.0.1 linkdown
172.22.0.0/16 dev br-1eb1f1e84df8  proto kernel  scope link  src 172.22.0.1 linkdown
172.23.0.0/16 dev br-aafed4ec941f  proto kernel  scope link  src 172.23.0.1 linkdown
192.168.65.0/29 dev eth0  proto kernel  scope link  src 192.168.65.2

/ # ip neigh show
192.168.65.1 dev eth0 lladdr f6:16:36:bc:f9:c6 STALE
172.17.0.7 dev docker0 lladdr 02:42:ac:11:00:07 STALE
172.17.0.6 dev docker0 lladdr 02:42:ac:11:00:06 STALE
172.17.0.5 dev docker0 lladdr 02:42:ac:11:00:05 STALE
More info on iproute2 here
nsenter
Purpose: nsenter is a powerful tool allowing you to enter into any namespaces. nsenter is available inside netshoot but requires netshoot to be run as a privileged container. Additionally, you may want to mount the /var/run/docker/netns directory to be able to enter any network namespace including bridge and overlay networks.
With docker run --name container-B --net container:container-A , docker uses container-A's network namespace ( including interfaces and routes) when creating container-B. This approach is helpful for troubleshooting network issues at the container level. To troubleshoot network issues at the bridge or overlay network level, you need to enter the namespace of the network itself. nsenter allows you to do that.
For example, if we wanted to check the L2 forwarding table for a overlay network. We need to enter the overlay network namespace and use same tools in netshoot to check these entries. The following examples go over some use cases for using nsenter to understand what's happening within a docker network ( overlay in this case).
# Creating an overlay network
🐳  → docker network create -d overlay nsenter-test
9tp0f348donsdj75pktssd97b

# Launching a simple busybox service with 3 replicas
🐳  → docker service create --name nsenter-l2-table-test --replicas 3 --network nsenter-test busybox ping localhost
3692i3q3u8nephdco2c10ro4c

# Inspecting the service
🐳  → docker network inspect nsenter-test
[
    {
        "Name": "nsenter-test",
        "Id": "9tp0f348donsdj75pktssd97b",
        "Scope": "swarm",
        "Driver": "overlay",
        "EnableIPv6": false,
        "IPAM": {
            "Driver": "default",
            "Options": null,
            "Config": [
                {
                    "Subnet": "10.0.1.0/24",
                    "Gateway": "10.0.1.1"
                }
            ]
        },
        "Internal": false,
        "Containers": {
            "0ebe0fab555d2e2ef2fcda634bef2071ad3f5842b06bd134b40f259ab9be4f13": {
                "Name": "nsenter-l2-table-test.2.83uezc16jcaz2rp6cjwyf4605",
                "EndpointID": "3064946bb0224a4b3647cefcba18dcbea71b90a2ba1c09212a7bc599ec1ed3eb",
                "MacAddress": "02:42:0a:00:01:04",
                "IPv4Address": "10.0.1.4/24",
                "IPv6Address": ""
            },
            "55065360ac1c71638fdef50a073a661dec53b693409c5e09f8f854abc7dbb373": {
                "Name": "nsenter-l2-table-test.1.4ryh3wmmv21nsrfwmilanypqq",
                "EndpointID": "f81ae5f979d6c54f60636ca9bb2107d95ebf9a08f64786c549e87a66190f1b1f",
                "MacAddress": "02:42:0a:00:01:03",
                "IPv4Address": "10.0.1.3/24",
                "IPv6Address": ""
            },
            "57eca277749bb01a488f0e6c4e91dc6720b7c8f08531536377b29a972971f54b": {
                "Name": "nsenter-l2-table-test.3.9cuoq5m2ue1wi4lsw64k88tvz",
                "EndpointID": "ff1a251ffd6c674cd5fd117386d1a197ab68b4ed708187035d91ff5bd5fe0251",
                "MacAddress": "02:42:0a:00:01:05",
                "IPv4Address": "10.0.1.5/24",
                "IPv6Address": ""
            }
        },
        "Options": {
            "com.docker.network.driver.overlay.vxlanid_list": "260"
        },
        "Labels": {}
    }
]

# Launching netshoot in privileged mode
 🐳  → docker run -it --rm -v /var/run/docker/netns:/var/run/docker/netns --privileged=true nicolaka/netshoot

# Listing all docker-created network namespaces

/ # cd /var/run/docker/netns/
/var/run/docker/netns # ls
0b1b36d33313  1-9tp0f348do  14d1428c3962  645eb414b538  816b96054426  916dbaa7ea76  db9fd2d68a9b  e79049ce9994  f857b5c01ced
1-9r17dodsxt  1159c401b8d8  1a508036acc8  7ca29d89293c  83b743f2f087  aeed676a57a5  default       f22ffa5115a0

# The overlay network that we created had an id of 9tp0f348donsdj75pktssd97b. All overlay networks are named <number>-<id>. We can see it in the list as `1-9tp0f348do`. To enter it:

/ # nsenter --net=/var/run/docker/netns/1-9tp0f348do sh

# Now all the commands we issue are within that namespace.

/ # ifconfig
br0       Link encap:Ethernet  HWaddr 02:15:B8:E7:DE:B3
          inet addr:10.0.1.1  Bcast:0.0.0.0  Mask:255.255.255.0
          inet6 addr: fe80::20ce:a5ff:fe63:437d%32621/64 Scope:Link
          UP BROADCAST RUNNING MULTICAST  MTU:1450  Metric:1
          RX packets:36 errors:0 dropped:0 overruns:0 frame:0
          TX packets:18 errors:0 dropped:0 overruns:0 carrier:0
          collisions:0 txqueuelen:0
          RX bytes:2224 (2.1 KiB)  TX bytes:1348 (1.3 KiB)

lo        Link encap:Local Loopback
          inet addr:127.0.0.1  Mask:255.0.0.0
          inet6 addr: ::1%32621/128 Scope:Host
          UP LOOPBACK RUNNING  MTU:65536  Metric:1
          RX packets:4 errors:0 dropped:0 overruns:0 frame:0
          TX packets:4 errors:0 dropped:0 overruns:0 carrier:0
          collisions:0 txqueuelen:1
          RX bytes:336 (336.0 B)  TX bytes:336 (336.0 B)

veth2     Link encap:Ethernet  HWaddr 02:15:B8:E7:DE:B3
          inet6 addr: fe80::15:b8ff:fee7:deb3%32621/64 Scope:Link
          UP BROADCAST RUNNING MULTICAST  MTU:1450  Metric:1
          RX packets:9 errors:0 dropped:0 overruns:0 frame:0
          TX packets:32 errors:0 dropped:0 overruns:0 carrier:0
          collisions:0 txqueuelen:0
          RX bytes:690 (690.0 B)  TX bytes:2460 (2.4 KiB)

veth3     Link encap:Ethernet  HWaddr 7E:55:C3:5C:C2:78
          inet6 addr: fe80::7c55:c3ff:fe5c:c278%32621/64 Scope:Link
          UP BROADCAST RUNNING MULTICAST  MTU:1450  Metric:1
          RX packets:13 errors:0 dropped:0 overruns:0 frame:0
          TX packets:26 errors:0 dropped:0 overruns:0 carrier:0
          collisions:0 txqueuelen:0
          RX bytes:970 (970.0 B)  TX bytes:1940 (1.8 KiB)

veth4     Link encap:Ethernet  HWaddr 72:95:AB:A1:6A:87
          inet6 addr: fe80::7095:abff:fea1:6a87%32621/64 Scope:Link
          UP BROADCAST RUNNING MULTICAST  MTU:1450  Metric:1
          RX packets:14 errors:0 dropped:0 overruns:0 frame:0
          TX packets:27 errors:0 dropped:0 overruns:0 carrier:0
          collisions:0 txqueuelen:0
          RX bytes:1068 (1.0 KiB)  TX bytes:2038 (1.9 KiB)

vxlan1    Link encap:Ethernet  HWaddr EA:EC:1D:B1:7D:D7
          inet6 addr: fe80::e8ec:1dff:feb1:7dd7%32621/64 Scope:Link
          UP BROADCAST RUNNING MULTICAST  MTU:1450  Metric:1
          RX packets:0 errors:0 dropped:0 overruns:0 frame:0
          TX packets:0 errors:0 dropped:33 overruns:0 carrier:0
          collisions:0 txqueuelen:0
          RX bytes:0 (0.0 B)  TX bytes:0 (0.0 B)

# Let's check out the L2 forwarding table. These MAC addresses belong to the tasks/containers in this service.

/ # bridge  fdb show br br0
33:33:00:00:00:01 dev br0 self permanent
01:00:5e:00:00:01 dev br0 self permanent
33:33:ff:63:43:7d dev br0 self permanent
ea:ec:1d:b1:7d:d7 dev vxlan1 master br0 permanent
02:15:b8:e7:de:b3 dev veth2 master br0 permanent
33:33:00:00:00:01 dev veth2 self permanent
01:00:5e:00:00:01 dev veth2 self permanent
33:33:ff:e7:de:b3 dev veth2 self permanent
7e:55:c3:5c:c2:78 dev veth3 master br0 permanent
33:33:00:00:00:01 dev veth3 self permanent
01:00:5e:00:00:01 dev veth3 self permanent
33:33:ff:5c:c2:78 dev veth3 self permanent
72:95:ab:a1:6a:87 dev veth4 master br0 permanent
33:33:00:00:00:01 dev veth4 self permanent
01:00:5e:00:00:01 dev veth4 self permanent
33:33:ff:a1:6a:87 dev veth4 self permanent


# ARP and routing tables. Note that an overlay network only routes traffic for that network. It only has a single route that matches the subnet of that network.

/ # ip neigh show
/ # ip route
10.0.1.0/24 dev br0  proto kernel  scope link  src 10.0.1.1

# Looks like the arp table is flushed. Let's ping some of the containers on this network.

/ # ping 10.0.1.4
PING 10.0.1.4 (10.0.1.4) 56(84) bytes of data.
64 bytes from 10.0.1.4: icmp_seq=1 ttl=64 time=0.207 ms
64 bytes from 10.0.1.4: icmp_seq=2 ttl=64 time=0.087 ms
^C
--- 10.0.1.4 ping statistics ---
2 packets transmitted, 2 received, 0% packet loss, time 1002ms
rtt min/avg/max/mdev = 0.087/0.147/0.207/0.060 ms

/ # ip neigh show
10.0.1.4 dev br0 lladdr 02:42:0a:00:01:04 REACHABLE

# and using bridge-utils to show interfaces of the overlay network local bridge.

/ # brctl show
bridge name	bridge id		STP enabled	interfaces
br0		8000.0215b8e7deb3	no		vxlan1
							veth2
							veth3
							veth4
CTOP
ctop is a free open source, simple and cross-platform top-like command-line tool for monitoring container metrics in real-time. It allows you to get an overview of metrics concerning CPU, memory, network, I/O for multiple containers and also supports inspection of a specific container.
To get data into ctop, you'll need to bind docker.sock into the netshoot container.
/ # docker run -it --rm -v /var/run/docker.sock:/var/run/docker.sock nicolaka/netshoot ctop
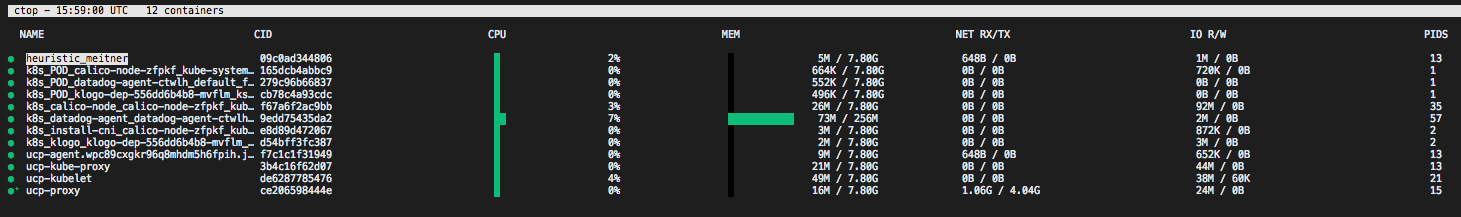
It will display running and existed containers with useful metrics to help troubleshoot resource issues; hit "q" to exit.
Termshark
Termshark is a terminal user-interface for tshark. It allows user to read pcap files or sniff live interfaces with Wireshark's display filters.
# Launching netshoot with NET_ADMIN and CAP_NET_RAW capabilities. Capturing packets on eth0 with icmp
/ # docker run --rm --cap-add=NET_ADMIN --cap-add=NET_RAW -it nicolaka/netshoot termshark -i eth0 icmp
# Launching netshoot with NET_ADMIN and CAP_NET_RAW capabilities Reading packets from ipv4frags.pcap

/ # docker run --rm --cap-add=NET_ADMIN --cap-add=NET_RAW -v /tmp/ipv4frags.pcap:/tmp/ipv4frags.pcap -it nicolaka/netshoot termshark -r /tmp/ipv4frags.pcap
More info on termshark here
Swaks
Swaks (Swiss Army Knife for SMTP) is a featureful, flexible, scriptable, transaction-oriented SMTP test tool. It is free to use and licensed under the GNU GPLv2.
You can use it to test and troubleshoot email servers with a crystal-clear syntax:
swaks --to user@example.com \
  --from fred@example.com --h-From: '"Fred Example" <fred@example.com>' \
  --auth CRAM-MD5 --auth-user me@example.com \
  --header-X-Test "test email" \
  --tls \
  --data "Example body"
More info, examples and lots of documentation on Swaks here
Grpcurl
grpcurl is a command-line tool that lets you interact with gRPC servers. It's basically curl for gRPC servers.
Invoking an RPC on a trusted server (e.g. TLS without self-signed key or custom CA) that requires no client certs and supports server reflection is the simplest thing to do with grpcurl. This minimal invocation sends an empty request body:
grpcurl grpc.server.com:443 my.custom.server.Service/Method

# no TLS
grpcurl -plaintext grpc.server.com:80 my.custom.server.Service/Method
More info, examples and lots of documentation on Grpcurl here
Fortio
Fortio is a fast, small (4Mb docker image, minimal dependencies), reusable, embeddable go library as well as a command line tool and server process, the server includes a simple web UI and REST API to trigger run and see graphical representation of the results (both a single latency graph and a multiple results comparative min, max, avg, qps and percentiles graphs).
$ fortio load http://www.google.com
Fortio X.Y.Z running at 8 queries per second, 8->8 procs, for 5s: http://www.google.com
19:10:33 I httprunner.go:84> Starting http test for http://www.google.com with 4 threads at 8.0 qps
Starting at 8 qps with 4 thread(s) [gomax 8] for 5s : 10 calls each (total 40)
19:10:39 I periodic.go:314> T002 ended after 5.056753279s : 10 calls. qps=1.9775534712220633
19:10:39 I periodic.go:314> T001 ended after 5.058085991s : 10 calls. qps=1.9770324224999916
19:10:39 I periodic.go:314> T000 ended after 5.058796046s : 10 calls. qps=1.9767549252963101
19:10:39 I periodic.go:314> T003 ended after 5.059557593s : 10 calls. qps=1.9764573910247019
Ended after 5.059691387s : 40 calls. qps=7.9056
Sleep times : count 36 avg 0.49175757 +/- 0.007217 min 0.463508712 max 0.502087879 sum 17.7032725
Aggregated Function Time : count 40 avg 0.060587641 +/- 0.006564 min 0.052549016 max 0.089893269 sum 2.42350566
# range, mid point, percentile, count
>= 0.052549 < 0.06 , 0.0562745 , 47.50, 19
>= 0.06 < 0.07 , 0.065 , 92.50, 18
>= 0.07 < 0.08 , 0.075 , 97.50, 2
>= 0.08 <= 0.0898933 , 0.0849466 , 100.00, 1
# target 50% 0.0605556
# target 75% 0.0661111
# target 99% 0.085936
# target 99.9% 0.0894975
Code 200 : 40
Response Header Sizes : count 40 avg 690.475 +/- 15.77 min 592 max 693 sum 27619
Response Body/Total Sizes : count 40 avg 12565.2 +/- 301.9 min 12319 max 13665 sum 502608
All done 40 calls (plus 4 warmup) 60.588 ms avg, 7.9 qps
More info, examples and lots of documentation on Fortio here
Contribution
Feel free to provide to contribute networking troubleshooting tools and use-cases by opening PRs. If you would like to add any package, please follow these steps:
- In the PR, please include some rationale as to why this tool is useful to be included in netshoot.
Note: If the functionality of the tool is already addressed by an existing tool, I might not accept the PR
- Change the Dockerfile to include the new package/tool
- If you're building the tool from source, make sure you leverage the multi-stage build process and update the
build/fetch_binaries.shscript - Update the README's list of included packages AND include a section on how to use the tool
- If the tool you're adding supports multi-platform, please make sure you highlight that.
编辑推荐精选


GPT Plus|Pro充值
GPT充值
支持 ChatGPT Plus / Pro 充值服务,支付便捷,自动发货,售后可查。


GPT Image 2中文站
AI 图片生成平台
GPT Image 2 是面向用户的 AI 图片生成平台,支持文生图、图生图及多模型创意工作流。


Vecbase
你的AI Agent团队
Vecbase 是专为 AI 团队打造的智能工作空间,将数据管理、模型协作与知识沉淀整合于一处。算法、产品与业务在同一平台无缝协同,让从数据到 AI 应用的落地更快一步。


音述AI
全球首个AI音乐社区
音述AI是全球首个AI音乐社区,致力让每个人都能用音乐表达自我。音述AI提供零门槛AI创作工具,独创GETI法则帮助用户精准定义音乐风格,AI润色功能支持自动优化作品质感。音述AI支持交流讨论、二次创作与价值变现。针对中文用户的语言习惯与文化背景进行专门优化,支持国风融合、C-pop等本土音乐标签,让技术更好地承载人文表达。


QoderWork
阿里Qoder团队推出的桌面端AI智能体
QoderWork 是阿里推出的本地优先桌面 AI 智能体,适配 macOS14+/Windows10+,以自然语言交互实现文件管理、数据分析、AI 视觉生成、浏览器自动化等办公任务,自主拆解执行复杂工作流,数据本地运行零上传,技能市场可无限扩展,是高效的 Agentic 生产力办公助手。


lynote.ai
一站式搞定所有学习需求
不再被海量信息淹没,开始真正理解知识。Lynote 可摘要 YouTube 视频、PDF、文章等内容。即时创建笔记,检测 AI 内容并下载资料,将您的学习效率提升 10 倍。


AniShort
为AI短剧协作而生
专为AI短剧协作而生的AniShort正式发布,深度重构AI短剧全流程生产模式,整合创意策划、制作执行、实时协作、在线审片、资产复用等全链路功能,独创无限画布、双轨并行工业化工作流与Ani智能体助手,集成多款主流AI大模型,破解素材零散、版本混乱、沟通低效等行业痛点,助力3人团队效率提升800%,打造标准化、可追溯的AI短剧量产体系,是AI短剧团队协同创作、提升制作效率的核心工具。


seedancetwo2.0
能听懂你表达的视频模型
Seedance two是基于seedance2.0的中国大模型,支持图像、视频、音频、文本四种模态输入,表达方式更丰富,生成也更可控。


nano-banana纳米香蕉中文站
国内直接访问,限时3折
输入简单文字,生成想要的图片,纳米香蕉中文站基于 Google 模型的 AI 图片生成网站,支持文字生图、图生图。官网价格限时3折活动


扣子-AI办公
职场AI,就�用扣子
AI办公助手,复杂任务高效处理。办公效率低?扣子空间AI助手支持播客生成、PPT制作、网页开发及报告写作,覆盖科研、商业、舆情等领域的专家Agent 7x24小时响应,生活工作无缝切换,提升50%效率!
推荐工具精选


AI云服务特惠
懂AI专属折扣关注微信公众号
最新AI工具、AI资讯
独家AI资源、AI项目落地

微信扫一扫关注公众号