


Give a 🌟 if it's useful and share with other Data Science Enthusiasts.
Data-Scientist-Roadmap (2021)
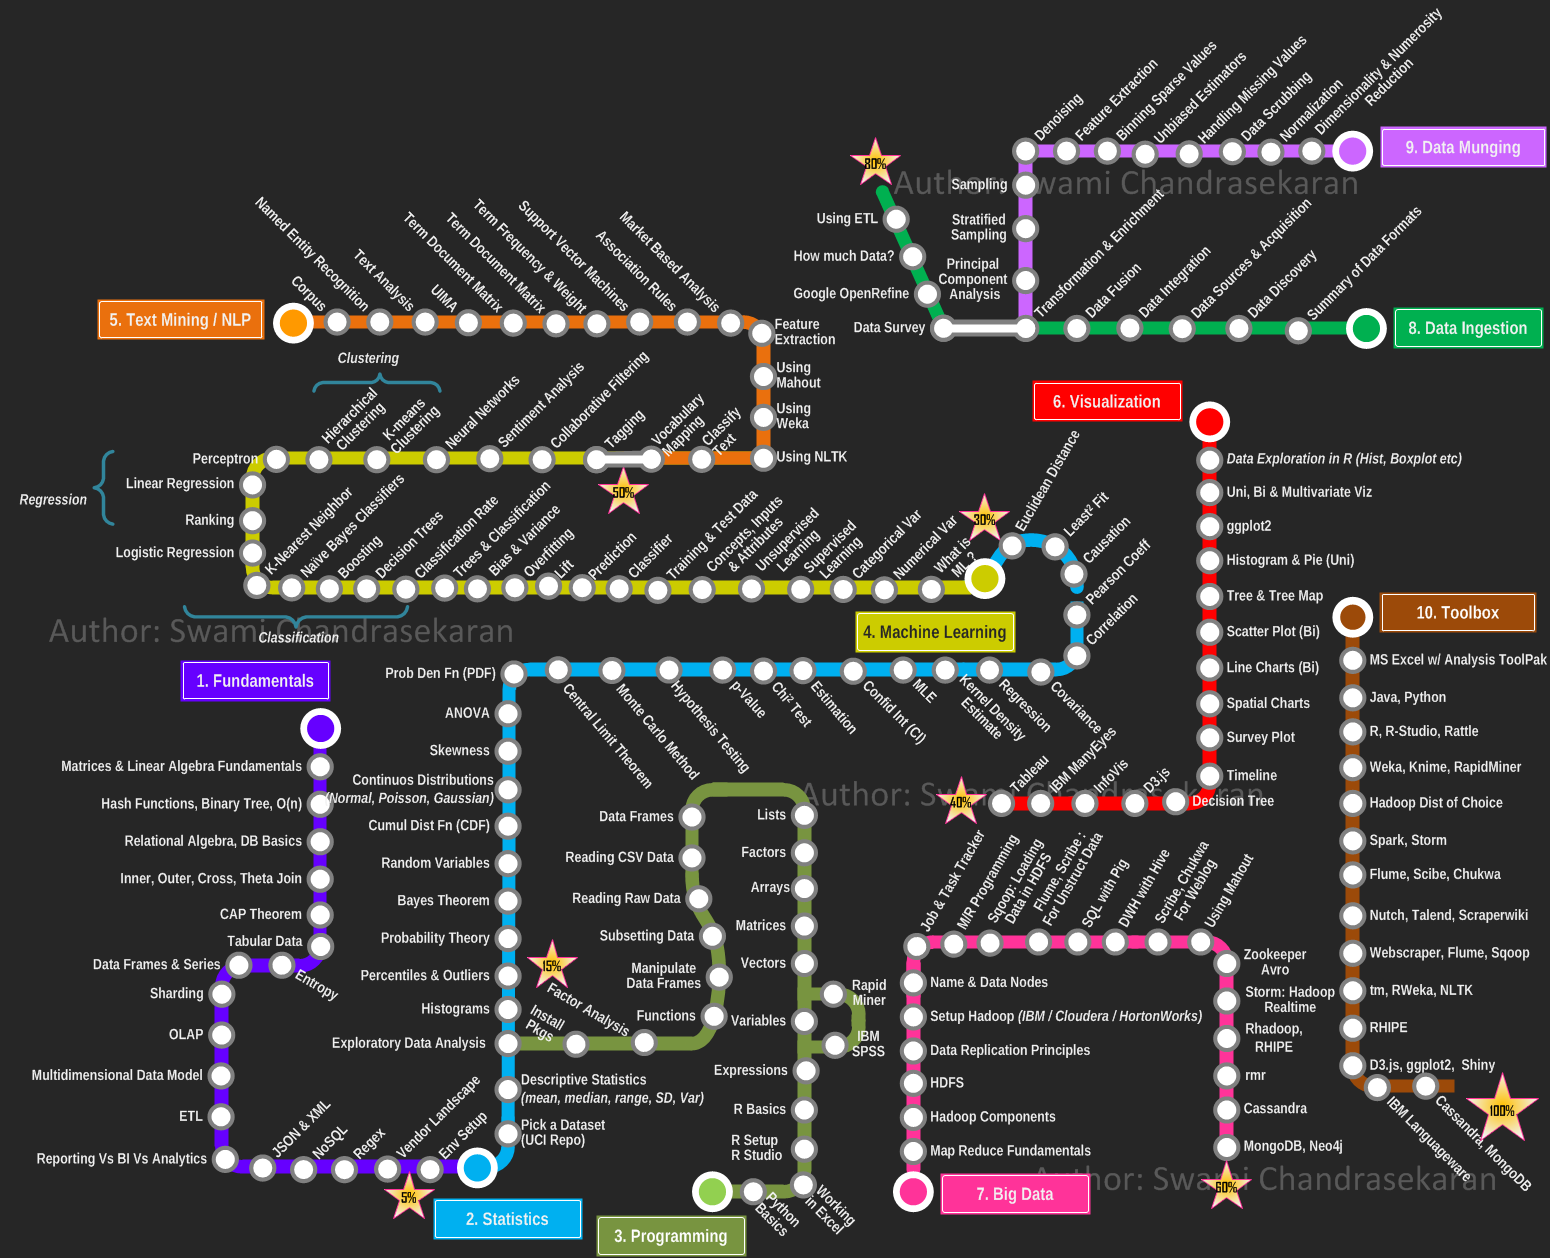
1_ Fundamentals
1_ Matrices & Algebra fundamentals
About
In mathematics, a matrix is a rectangular array of numbers, symbols, or expressions, arranged in rows and columns. A matrix could be reduced as a submatrix of a matrix by deleting any collection of rows and/or columns.

Operations
There are a number of basic operations that can be applied to modify matrices:
2_ Hash function, binary tree, O(n)
Hash function
Definition
A hash function is any function that can be used to map data of arbitrary size to data of fixed size. One use is a data structure called a hash table, widely used in computer software for rapid data lookup. Hash functions accelerate table or database lookup by detecting duplicated records in a large file.

Binary tree
Definition
In computer science, a binary tree is a tree data structure in which each node has at most two children, which are referred to as the left child and the right child.

O(n)
Definition
In computer science, big O notation is used to classify algorithms according to how their running time or space requirements grow as the input size grows. In analytic number theory, big O notation is often used to express a bound on the difference between an arithmetical function and a better understood approximation.
3_ Relational algebra, DB basics
Definition
Relational algebra is a family of algebras with a well-founded semantics used for modelling the data stored in relational databases, and defining queries on it.
The main application of relational algebra is providing a theoretical foundation for relational databases, particularly query languages for such databases, chief among which is SQL.
Natural join
About
In SQL language, a natural junction between two tables will be done if :
- At least one column has the same name in both tables
- Theses two columns have the same data type
- CHAR (character)
- INT (integer)
- FLOAT (floating point numeric data)
- VARCHAR (long character chain)
mySQL request
    SELECT <COLUMNS>
    FROM <TABLE_1>
    NATURAL JOIN <TABLE_2>

    SELECT <COLUMNS>
    FROM <TABLE_1>, <TABLE_2>
    WHERE TABLE_1.ID = TABLE_2.ID
4_ Inner, Outer, Cross, theta-join
Inner join
The INNER JOIN keyword selects records that have matching values in both tables.
Request
  SELECT column_name(s)
  FROM table1
  INNER JOIN table2 ON table1.column_name = table2.column_name;
Outer join
The FULL OUTER JOIN keyword return all records when there is a match in either left (table1) or right (table2) table records.
Request
  SELECT column_name(s)
  FROM table1
  FULL OUTER JOIN table2 ON table1.column_name = table2.column_name;
Left join
The LEFT JOIN keyword returns all records from the left table (table1), and the matched records from the right table (table2). The result is NULL from the right side, if there is no match.
Request
  SELECT column_name(s)
  FROM table1
  LEFT JOIN table2 ON table1.column_name = table2.column_name;
Right join
The RIGHT JOIN keyword returns all records from the right table (table2), and the matched records from the left table (table1). The result is NULL from the left side, when there is no match.
Request
  SELECT column_name(s)
  FROM table1
  RIGHT JOIN table2 ON table1.column_name = table2.column_name;
5_ CAP theorem
It is impossible for a distributed data store to simultaneously provide more than two out of the following three guarantees:
- Every read receives the most recent write or an error.
- Every request receives a (non-error) response – without guarantee that it contains the most recent write.
- The system continues to operate despite an arbitrary number of messages being dropped (or delayed) by the network between nodes.
In other words, the CAP Theorem states that in the presence of a network partition, one has to choose between consistency and availability. Note that consistency as defined in the CAP Theorem is quite different from the consistency guaranteed in ACID database transactions.
6_ Tabular data
Tabular data are opposed to relational data, like SQL database.
In tabular data, everything is arranged in columns and rows. Every row have the same number of column (except for missing value, which could be substituted by "N/A".
The first line of tabular data is most of the time a header, describing the content of each column.
The most used format of tabular data in data science is CSV_. Every column is surrounded by a character (a tabulation, a coma ..), delimiting this column from its two neighbours.
7_ Entropy
Entropy is a measure of uncertainty. High entropy means the data has high variance and thus contains a lot of information and/or noise.
For instance, a constant function where f(x) = 4 for all x has no entropy and is easily predictable, has little information, has no noise and can be succinctly represented . Similarly, f(x) = ~4 has some entropy while f(x) = random number is very high entropy due to noise.
8_ Data frames & series
A data frame is used for storing data tables. It is a list of vectors of equal length.
A series is a series of data points ordered.
9_ Sharding
Sharding is horizontal(row wise) database partitioning as opposed to vertical(column wise) partitioning which is Normalization
Why use Sharding?
-
Database systems with large data sets or high throughput applications can challenge the capacity of a single server.
-
Two methods to address the growth : Vertical Scaling and Horizontal Scaling
-
Vertical Scaling
- Involves increasing the capacity of a single server
- But due to technological and economical restrictions, a single machine may not be sufficient for the given workload.
-
Horizontal Scaling
- Involves dividing the dataset and load over multiple servers, adding additional servers to increase capacity as required
- While the overall speed or capacity of a single machine may not be high, each machine handles a subset of the overall workload, potentially providing better efficiency than a single high-speed high-capacity server.
- Idea is to use concepts of Distributed systems to achieve scale
- But it comes with same tradeoffs of increased complexity that comes hand in hand with distributed systems.
- Many Database systems provide Horizontal scaling via Sharding the datasets.
10_ OLAP
Online analytical processing, or OLAP, is an approach to answering multi-dimensional analytical (MDA) queries swiftly in computing.
OLAP is part of the broader category of business intelligence, which also encompasses relational database, report writing and data mining. Typical applications of OLAP include _business reporting for sales, marketing, management reporting, business process management (BPM), budgeting and forecasting, financial reporting and similar areas, with new applications coming up, such as agriculture.
The term OLAP was created as a slight modification of the traditional database term online transaction processing (OLTP).
11_ Multidimensional Data model
12_ ETL
-
Extract
- extracting the data from the multiple heterogenous source system(s)
- data validation to confirm whether the data pulled has the correct/expected values in a given domain
-
Transform
- extracted data is fed into a pipeline which applies multiple functions on top of data
- these functions intend to convert the data into the format which is accepted by the end system
- involves cleaning the data to remove noise, anamolies and redudant data
-
Load
- loads the transformed data into the end target
13_ Reporting vs BI vs Analytics
14_ JSON and XML
JSON
JSON is a language-independent data format. Example describing a person:
{
  "firstName": "John",
  "lastName": "Smith",
  "isAlive": true,
  "age": 25,
  "address": {
    "streetAddress": "21 2nd Street",
    "city": "New York",
    "state": "NY",
    "postalCode": "10021-3100"
  },
  "phoneNumbers": [
    {
      "type": "home",
      "number": "212 555-1234"
    },
    {
      "type": "office",
      "number": "646 555-4567"
    },
    {
      "type": "mobile",
      "number": "123 456-7890"
    }
  ],
  "children": [],
  "spouse": null
}
XML
Extensible Markup Language (XML) is a markup language that defines a set of rules for encoding documents in a format that is both human-readable and machine-readable.
<CATALOG>
  <PLANT>
    <COMMON>Bloodroot</COMMON>
    <BOTANICAL>Sanguinaria canadensis</BOTANICAL>
    <ZONE>4</ZONE>
    <LIGHT>Mostly Shady</LIGHT>
    <PRICE>$2.44</PRICE>
    <AVAILABILITY>031599</AVAILABILITY>
  </PLANT>
  <PLANT>
    <COMMON>Columbine</COMMON>
    <BOTANICAL>Aquilegia canadensis</BOTANICAL>
    <ZONE>3</ZONE>
    <LIGHT>Mostly Shady</LIGHT>
    <PRICE>$9.37</PRICE>
    <AVAILABILITY>030699</AVAILABILITY>
  </PLANT>
  <PLANT>
    <COMMON>Marsh Marigold</COMMON>
    <BOTANICAL>Caltha palustris</BOTANICAL>
    <ZONE>4</ZONE>
    <LIGHT>Mostly Sunny</LIGHT>
    <PRICE>$6.81</PRICE>
    <AVAILABILITY>051799</AVAILABILITY>
  </PLANT>
</CATALOG>
15_ NoSQL
noSQL is oppsed to relationnal databases (stand for __N__ot __O__nly SQL). Data are not structured and there's no notion of keys between tables.
Any kind of data can be stored in a noSQL database (JSON, CSV, ...) whithout thinking about a complex relationnal scheme.
Commonly used noSQL stacks: Cassandra, MongoDB, Redis, Oracle noSQL ...
16_ Regex
About
Reg ular ex pressions (regex) are commonly used in informatics.
It can be used in a wide range of possibilities :
- Text replacing
- Extract information in a text (email, phone number, etc)
- List files with the .txt extension ..
http://regexr.com/ is a good website for experimenting on Regex.
Utilisation
To use them in Python, just import:
import re
17_ Vendor landscape
18_ Env Setup
2_ Statistics
1_ Pick a dataset
Datasets repositories
Generalists
Medical
Other languages
French
2_ Descriptive statistics
Mean
In probability and statistics, population mean and expected value are used synonymously to refer to one measure of the central tendency either of a probability distribution or of the random variable characterized by that distribution.
For a data set, the terms arithmetic mean, mathematical expectation, and sometimes average are used synonymously to refer to a central value of a discrete set of numbers: specifically, the sum of the values divided by the number of values.

Median
The median is the value separating the higher half of a data sample, a population, or a probability distribution, from the lower half. In simple terms, it may be thought of as the "middle" value of a data set.
Descriptive statistics in Python
Numpy is a python library widely used for statistical analysis.
Installation
pip3 install numpy
Utilization
import numpy
3_ Exploratory data analysis
The step includes visualization and analysis of data.
Raw data may possess improper distributions of data which may lead to issues moving forward.
Again, during applications we must also know the distribution of data, for instance, the fact whether the data is linear or spirally distributed.
Libraries in Python
Library used to plot graphs in Python
Installation:
pip3 install matplotlib
Utilization:
import matplotlib.pyplot as plt
Library used to large datasets in python
Installation:
pip3 install pandas
Utilization:
import pandas as pd
Yet another Graph Plotting Library in Python.
Installation:
pip3 install seaborn
Utilization:
import seaborn as sns
PCA
PCA stands for principle component analysis.
We often require to shape of the data distribution as we have seen previously. We need to plot the data for the same.
Data can be Multidimensional, that is, a dataset can have multiple features.
We can plot only two dimensional data, so, for multidimensional data, we project the multidimensional distribution in two dimensions, preserving the principle components of the distribution, in order to get an idea of the actual distribution through the 2D plot.
It is used for dimensionality reduction also. Often it is seen that several features do not significantly contribute any important insight to the data distribution. Such features creates complexity and increase dimensionality of the data. Such features are not considered which results in decrease of the dimensionality of the data.
4_ Histograms
Histograms are representation of distribution of numerical data. The procedure consists of binnng the numeric values using range divisions i.e, the entire range in which the data varies is split into several fixed intervals. Count or frequency of occurences of the numbers in the range of the bins are represented.
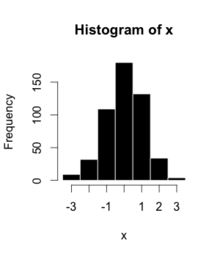
In python, Pandas,Matplotlib,Seaborn can be used to create Histograms.
5_ Percentiles & outliers
Percentiles
Percentiles are numberical measures in statistics, which represents how much or what percentage of data falls below a given number or instance in a numerical data distribution.
For instance, if we say 70 percentile, it represents, 70% of the data in the ditribution are below the given numerical value.
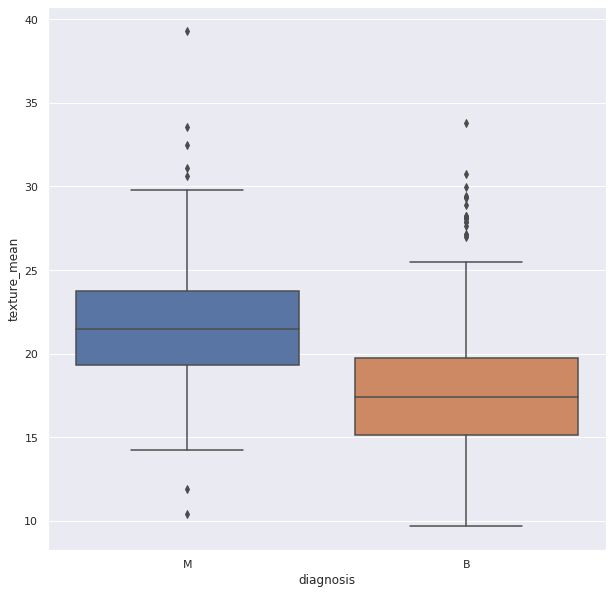
Outliers
Outliers are data points(numerical) which have significant differences with other data points. They differ from majority of points in the distribution. Such points may cause the central measures of distribution, like mean, and median. So, they need to be detected and removed.
Box Plots can be used detect Outliers in the data. They can be created using Seaborn library
6_ Probability theory
Probability is the likelihood of an event in a Random experiment. For instance, if a coin is tossed, the chance of getting a head is 50% so, probability is 0.5.
Sample Space: It is the set of all possible outcomes of a Random Experiment. Favourable Outcomes: The set of outcomes we are looking for in a Random Experiment
Probability = (Number of Favourable Outcomes) / (Sample Space)
Probability theory is a branch of mathematics that is associated with the concept of probability.
[Basics of
编辑推荐精选


音述AI
全球首个AI音乐社区
音述AI是全球首个AI音乐社区,致力让每个人都能用音乐表达自我。音述AI提供零门槛AI创作工具,独创GETI法则帮助用户精准定义音乐风格,AI润色功能支持自动优化作品质感。音述AI支持交流讨论、二次创作与价值变现。针对中文用户的语言习惯与文化背景进行专门优化,支持国风融合、C-pop等本土音乐标签,让技术更好地承载人文表达。


QoderWork
阿里Qoder团队推出的桌面端AI智能体
QoderWork 是阿里推出的本地优先桌面 AI 智能体,适配 macOS14+/Windows10+,以自然语言交互实现文件管理、数据分析、AI 视觉生成、浏览器自动化等办公任务,自主拆解执行复杂工作流,数据本地运行零上传,技能市场可无限扩展,是高效的 Agentic 生产力办公助手。


lynote.ai
一站式搞定所有学习需求
不再被海量信息淹没,开始真正理解知识。Lynote 可摘要 YouTube 视频、PDF、文章等内容。即时创建笔记,检测 AI 内容并下载资料,将您的学习效率提升 10 倍。


AniShort
为AI短剧协作而生
专为AI短剧协作而生的AniShort正式发布,深度重构AI短剧全流程生产模式,整合创意策划、制作执行、实时协作、在线审片、资产复用等全链路功能,独创无限画布、双轨并行工业化工作流与Ani智能体助手,集成多款主流AI大模型,破解素材零散、版本混乱、沟通低效等行业痛点,助力3人团队效率提升800%,打造标准化、可追溯的AI短剧量产体系,是AI短剧团队协同创作、提升制作效率的核心工具。


seedancetwo2.0
能听懂你表达的视频模型
Seedance two是基于seedance2.0的中国大模型,支持图像、视频、音频、文本四种模态输入,表达方式更丰富,生成也更可控。


nano-banana纳米香蕉中文站
国内直接访问,限时3折
输入简单文字,生成想要的图片,纳米香蕉中文站基于 Google 模型的 AI 图片生成网站,支持文字生图、图生图。官网价格限时3折活动


扣子-AI办公
职场AI,就用扣子
AI办公助手,复杂任务高效处理。办公效率低?扣子空间AI助手支持播客生成、PPT制作、网页开发及报告写作,覆盖科研、商业、舆情等领域的专家Agent 7x24小时响应,生活工作无缝切换,提升50%效率!


堆友
多风格AI绘画神器
堆友平台由阿里巴巴设计团队创建,作为一款AI驱动的设计工具,专为设计师提供一站式增长服务。功能覆盖海量3D素材、AI绘画、实时渲染以及专业抠图,显著提升设计品质和效率。平台不仅提供工具,还是一个促进创意交流和��个人发展的空间,界面友好,适合所有级别的设计师和创意工作者。


码上飞
零代码AI应用开发平台
零代码AI应用开发平台,用户只需一句话简单描述需求,AI能自动生成小程序、APP或H5网页应用,无需编写代码。


Vora
免费创建高清无水印Sora视频
Vora是一个免费创建高清无水印Sora视频的AI工具
推荐工具精选


AI云服务特惠
懂AI专属折扣关注微信公众号
最新AI工具、AI资讯
独家AI资源、AI项目落地

微信扫一扫关注公众号