


Introduction
Elastic Stack (ELK) Docker Composition, preconfigured with Security, Monitoring, and Tools; Up with a Single Command.
Suitable for Demoing, MVPs and small production deployments.
Stack Version: 8.10.2 🎉 - Based on Official Elastic Docker Images
You can change Elastic Stack version by setting
ELK_VERSIONin.envfile and rebuild your images. Any version >= 8.0.0 is compatible with this template.
Main Features 📜
- Configured as a Production Single Node Cluster. (With a multi-node cluster option for experimenting).
- Security Enabled By Default.
- Configured to Enable:
- Logging & Metrics Ingestion
- Option to collect logs of all Docker Containers running on the host. via
make collect-docker-logs.
- Option to collect logs of all Docker Containers running on the host. via
- APM
- Alerting
- Machine Learning
- Anomaly Detection
- SIEM (Security information and event management).
- Enabling Trial License
- Logging & Metrics Ingestion
- Use Docker-Compose and
.envto configure your entire stack parameters. - Persist Elasticsearch's Keystore and SSL Certifications.
- Self-Monitoring Metrics Enabled.
- Prometheus Exporters for Stack Metrics.
- Embedded Container Healthchecks for Stack Images.
More points
And comparing Elastdocker and the popular deviantony/docker-elk
<details><summary>Expand...</summary> <p>One of the most popular ELK on Docker repositories is the awesome deviantony/docker-elk.
Elastdocker differs from deviantony/docker-elk in the following points.
-
Security enabled by default using Basic license, not Trial.
-
Persisting data by default in a volume.
-
Run in Production Mode (by enabling SSL on Transport Layer, and add initial master node settings).
-
Persisting Generated Keystore, and create an extendable script that makes it easier to recreate it every-time the container is created.
-
Parameterize credentials in .env instead of hardcoding
elastich:changemein every component config. -
Parameterize all other Config like Heap Size.
-
Add recommended environment configurations as Ulimits and Swap disable to the docker-compose.
-
Make it ready to be extended into a multinode cluster.
-
Configuring the Self-Monitoring and the Filebeat agent that ship ELK logs to ELK itself. (as a step to shipping it to a monitoring cluster in the future).
-
Configured Prometheus Exporters.
-
The Makefile that simplifies everything into some simple commands.
Requirements
- Docker 20.05 or higher
- Docker-Compose 1.29 or higher
- 4GB RAM (For Windows and MacOS make sure Docker's VM has more than 4GB+ memory.)
Setup
-
Clone the Repository
git clone https://github.com/sherifabdlnaby/elastdocker.git -
Initialize Elasticsearch Keystore and TLS Self-Signed Certificates
$ make setupFor Linux's docker hosts only. By default virtual memory is not enough so run the next command as root
sysctl -w vm.max_map_count=262144 -
Start Elastic Stack
$ make elk <OR> $ docker-compose up -d <OR> $ docker compose up -d -
Visit Kibana at https://localhost:5601 or
https://<your_public_ip>:5601Default Username:
elastic, Password:changeme- Notice that Kibana is configured to use HTTPS, so you'll need to write
https://beforelocalhost:5601in the browser. - Modify
.envfile for your needs, most importantlyELASTIC_PASSWORDthat setup your superuserelastic's password,ELASTICSEARCH_HEAP&LOGSTASH_HEAPfor Elasticsearch & Logstash Heap Size.
- Notice that Kibana is configured to use HTTPS, so you'll need to write
Whatever your Host (e.g AWS EC2, Azure, DigitalOcean, or on-premise server), once you expose your host to the network, ELK component will be accessible on their respective ports. Since the enabled TLS uses a self-signed certificate, it is recommended to SSL-Terminate public traffic using your signed certificates.
🏃🏻♂️ To start ingesting logs, you can start by running
make collect-docker-logswhich will collect your host's container logs.
Additional Commands
<details><summary>Expand</summary> <p>To Start Monitoring and Prometheus Exporters
$ make monitoring
To Ship Docker Container Logs to ELK
$ make collect-docker-logs
To Start Elastic Stack, Tools and Monitoring
$ make all
To Start 2 Extra Elasticsearch nodes (recommended for experimenting only)
$ make nodes
To Rebuild Images
$ make build
Bring down the stack.
$ make down
Reset everything, Remove all containers, and delete DATA!
</p> </details>$ make prune
Configuration
- Some Configuration are parameterized in the
.envfile.ELASTIC_PASSWORD, userelastic's password (default:changemepls).ELK_VERSIONElastic Stack Version (default:8.10.2)ELASTICSEARCH_HEAP, how much Elasticsearch allocate from memory (default: 1GB -good for development only-)LOGSTASH_HEAP, how much Logstash allocate from memory.- Other configurations which their such as cluster name, and node name, etc.
- Elasticsearch Configuration in
elasticsearch.ymlat./elasticsearch/config. - Logstash Configuration in
logstash.ymlat./logstash/config/logstash.yml. - Logstash Pipeline in
main.confat./logstash/pipeline/main.conf. - Kibana Configuration in
kibana.ymlat./kibana/config.
Setting Up Keystore
You can extend the Keystore generation script by adding keys to ./setup/keystore.sh script. (e.g Add S3 Snapshot Repository Credentials)
To Re-generate Keystore:
make keystore
Notes
-
⚠️ Elasticsearch HTTP layer is using SSL, thus mean you need to configure your elasticsearch clients with the
CAinsecrets/certs/ca/ca.crt, or configure client to ignore SSL Certificate Verification (e.g--insecureincurl). -
Adding Two Extra Nodes to the cluster will make the cluster depending on them and won't start without them again.
-
Makefile is a wrapper around
Docker-Composecommands, usemake helpto know every command. -
Elasticsearch will save its data to a volume named
elasticsearch-data -
Elasticsearch Keystore (that contains passwords and credentials) and SSL Certificate are generated in the
./secretsdirectory by the setup command. -
Make sure to run
make setupif you changedELASTIC_PASSWORDand to restart the stack afterwards. -
For Linux Users it's recommended to set the following configuration (run as
root)sysctl -w vm.max_map_count=262144By default, Virtual Memory is not enough.


Working with Elastic APM
After completing the setup step, you will notice a container named apm-server which gives you deeper visibility into your applications and can help you to identify and resolve root cause issues with correlated traces, logs, and metrics.
Authenticating with Elastic APM
In order to authenticate with Elastic APM, you will need the following:
- The value of
ELASTIC_APM_SECRET_TOKENdefined in.envfile as we have secret token enabled by default - The ability to reach port
8200 - Install elastic apm client in your application e.g. for NodeJS based applications you need to install elastic-apm-node
- Import the package in your application and call the start function, In case of NodeJS based application you can do the following:
const apm = require('elastic-apm-node').start({
  serviceName: 'foobar',
  secretToken: process.env.ELASTIC_APM_SECRET_TOKEN,

  // https is enabled by default as per elastdocker configuration
  serverUrl: 'https://localhost:8200',
})
Make sure that the agent is started before you require any other modules in your Node.js application - i.e. before express, http, etc. as mentioned in Elastic APM Agent - NodeJS initialization
For more details or other languages you can check the following:
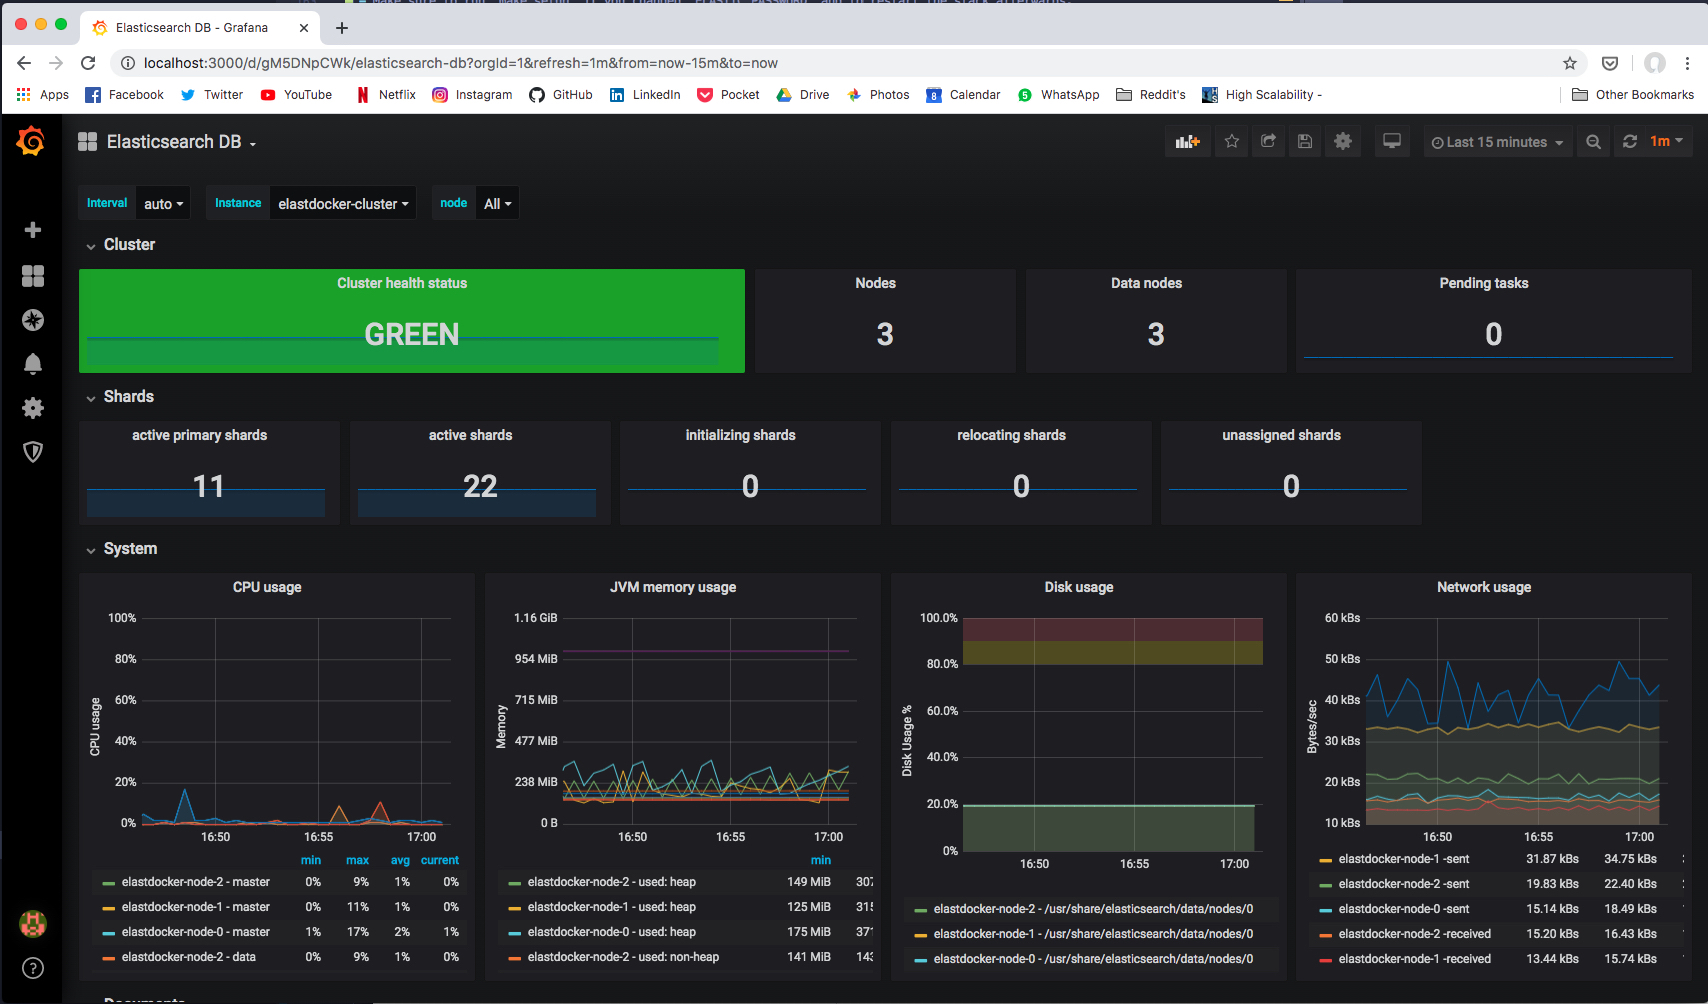
Monitoring The Cluster
Via Self-Monitoring
Head to Stack Monitoring tab in Kibana to see cluster metrics for all stack components.


In Production, cluster metrics should be shipped to another dedicated monitoring cluster.
Via Prometheus Exporters
If you started Prometheus Exporters using make monitoring command. Prometheus Exporters will expose metrics at the following ports.
| Prometheus Exporter | Port | Recommended Grafana Dashboard |
|---|---|---|
elasticsearch-exporter | 9114 | Elasticsearch by Kristian Jensen |
logstash-exporter | 9304 | logstash-monitoring by dpavlos |
License
MIT License Copyright (c) 2022 Sherif Abdel-Naby
Contribution
PR(s) are Open and
编辑推荐精选


扣子-AI办公
职场AI,就用扣子
AI办公助手,复杂任务高效处理。办公效率低?扣子空间AI助手支持播客生成、PPT制作、网页开发及报告写作,覆盖科研、商业、舆情等领域的专家Agent 7x24小时响应,生活工作无缝切换,提升50%效率!


堆友
多风格AI绘画神器
堆友平台由阿里巴巴设计团队创建,作为一款AI驱动的设计工具,专为设计师提供一站式增长服务。功能覆盖海量3D素材、AI绘画、实时渲染以及专业抠图,显著提升设计品质和效率。平台不仅提供工具,还是一个促进创意交流和个人发展的空间,界面友好,适合所有级别的设计师和创意工作者。


码上飞
零代码AI应用开发平台
零代码AI应用开发平台,用户只需一句话简单描述需求,AI能自动生成小程序、APP或H5网页应用,无需编写代码。


Vora
免费创建高清无水印Sora视频
Vora是一个免费创建高清无水印Sora视频的AI工具


Refly.AI
最适合小白的AI自动化工作流平台
�无需编码,轻松生成可复用、可变现的AI自动化工作流


酷表ChatExcel
大模型驱动的Excel数据处理工具
基于大模型交互的表格处理系统,允许用户通过对话方式完成数据整理和可视化分析。系统采用机器学习算法解析用户指令,自动执行排序、公式计算和数据透视等操作,支持多种文件格式导入导出。数据处理响应速度保持在0.8秒以内,支持超过100万行数据的即时分析。


TRAE编程
AI辅助编程,代码自动修复
Trae是一种自适应的集成开发环境(IDE),通过自动化和多元协作改变开发流程。利用Trae,团队能够更快速、精确地编写和部署代码,从而提高编程效率和项目交付速度。Trae具备上下文感知和代码自动完成功能,是提升开发效率的理想工具。


AIWritePaper论文写作
AI论文写作指导平台
AIWritePaper论文写作是一站式AI论文写作辅助工具,简化了选题、文献检索至论文撰写的整个过程。通过简单设定,平台可快速生成高质量论文大纲和全文,配合图表、参考文献等一应俱全,同时提供开题报告和答辩PPT等增值服务,保障数据安全,有效提升写作效率和论文质量。

博思AIPPT
AI一键生成PPT,就用博思AIPPT!
博思AIPPT,新一代的AI生成PPT平台,支持智能生成PPT、AI美化PPT、文本&链接生成PPT、导入Word/PDF/Markdown文档生成PPT等,内置海量精美PPT模板,涵盖商务、教育、科技等不同风格,同时针对每个页面提供多种版式,一键自适应切换,完美适配各种办公场景。


潮际好麦
AI赋能电商视觉革命,一站式智能商拍平台
潮际好麦深耕服装行业,是国内AI试衣效果最好的软件。使用先进AIGC能力为电商卖家批量提供优质的、低成本的商拍图。合作品牌有Shein、Lazada、安踏、百丽等65个国内外头部品牌,以及国内10万+淘宝、天猫、京东等主流平台的品牌商家,为卖家节省将近85%的出图成本,提升约3倍出图效率,让品牌能够快速上架。
推荐工具精选


AI云服务特惠
懂AI专属折扣关注微信公众号
最新AI工具、AI资讯
独家AI资源、AI项目落地

微信扫一扫关注公众号