


- Overview
- Installation
- Setup
- Configuration
- Performa Satellite
- Components
- Command Line
- Development
- License
Overview
Performa is a multi-server monitoring system with a web based front-end UI. It can monitor CPU, memory, disk, network, and of course your own custom metrics. Alerts can be configured to trigger on any expression, and send e-mails or fire web hooks. Timeline data can be stored on local disk or in Amazon S3.
Features at a Glance
- Easy to install, configure and run
- Monitor any number of servers
- New servers are added to the system automatically
- Assign servers to groups manually or automatically
- Supports ephemeral servers (serverless, autoscale, etc.)
- Metrics are collected every minute
- Multiple graph scales: hourly, daily, monthly, yearly
- Real-time views with auto-refreshing graphs
- View graphs for individual servers or entire groups
- Add custom commands for graphing your own metrics
- Alerts with custom trigger expressions
- Alert e-mails and web hooks for notification
- Alert snooze feature to silence notifications
- Snapshot feature provides extra server details
- One click snapshot-to-URL-to-clipboard for graphs
- Graph data can be kept indefinitely or auto-expired
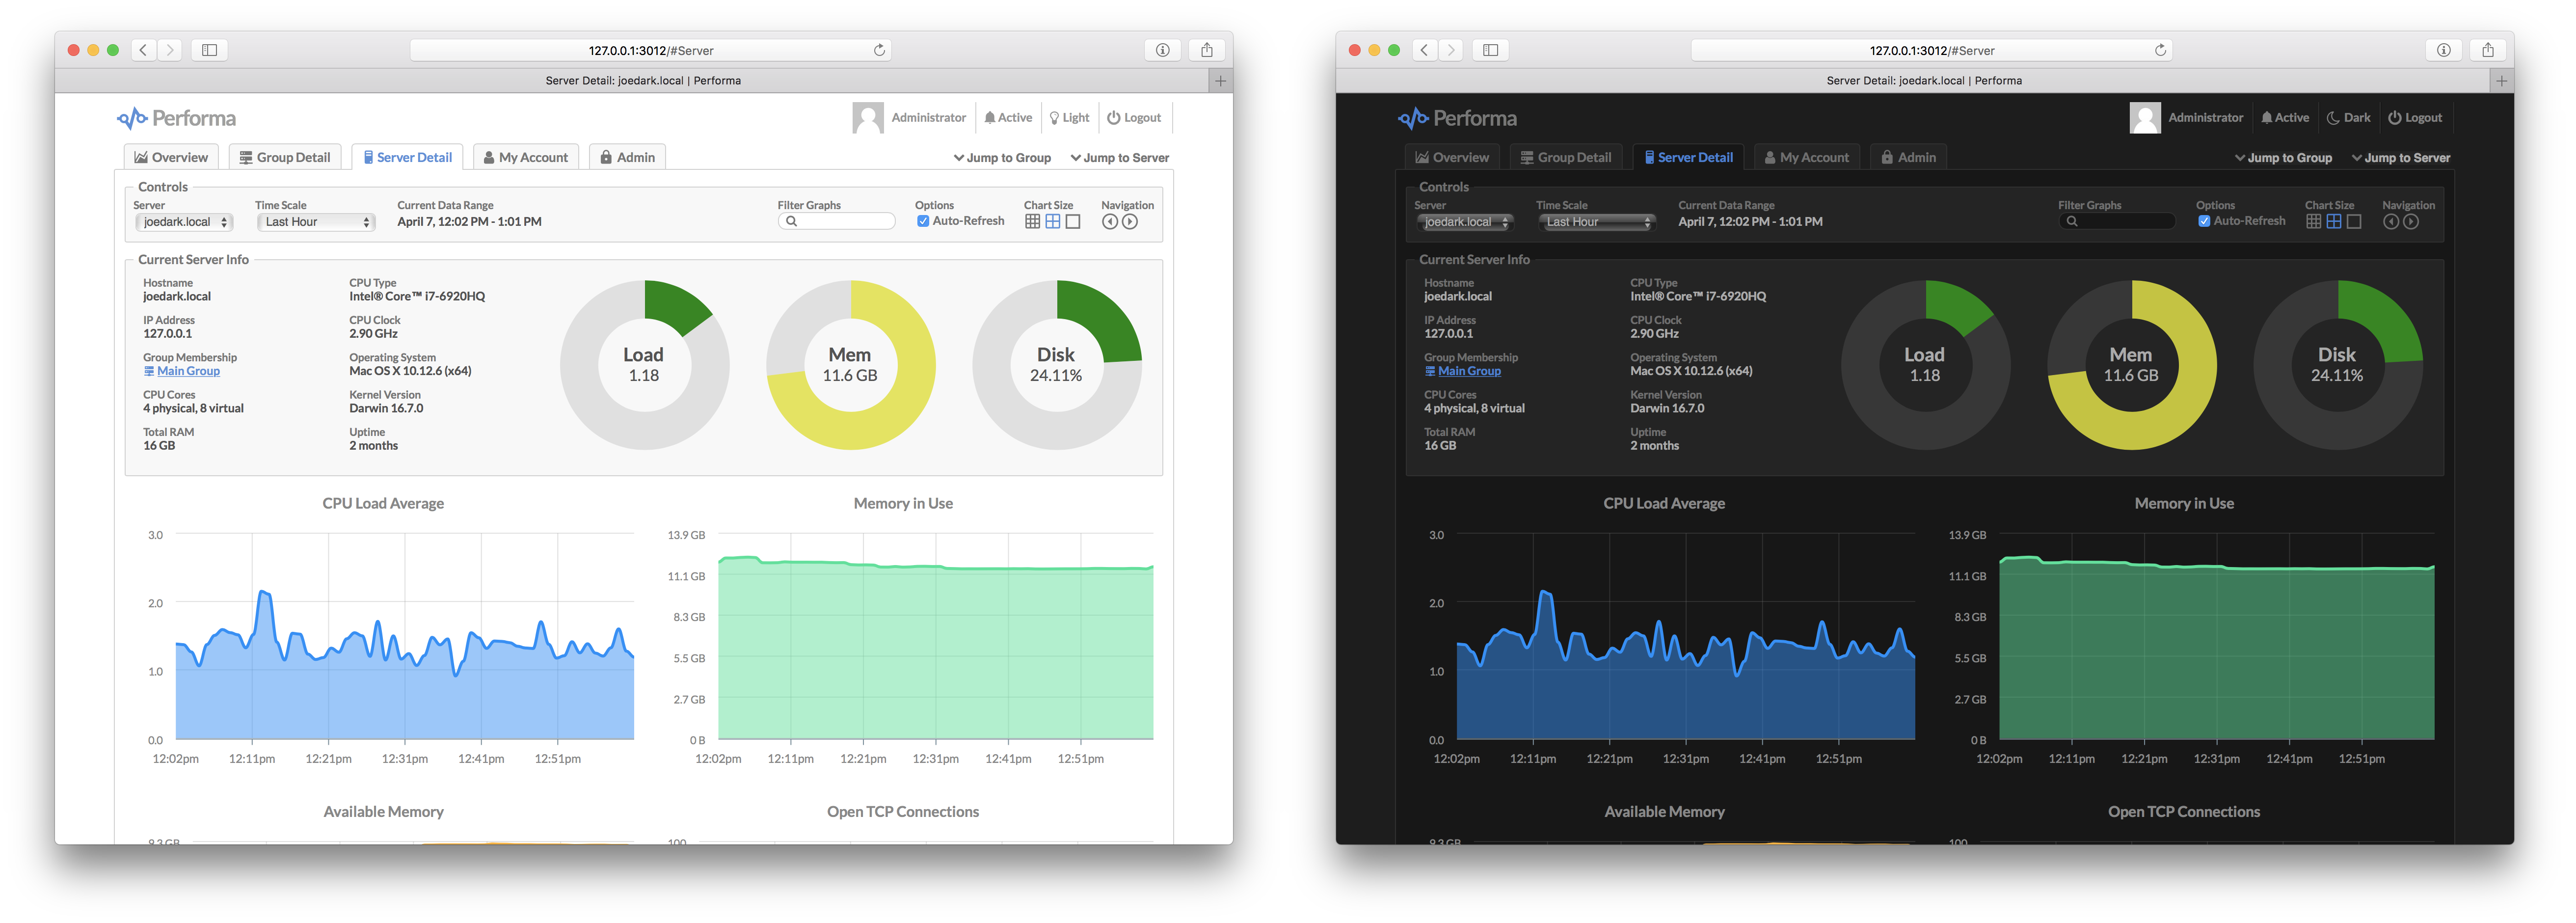
- Light and dark themes for the UI
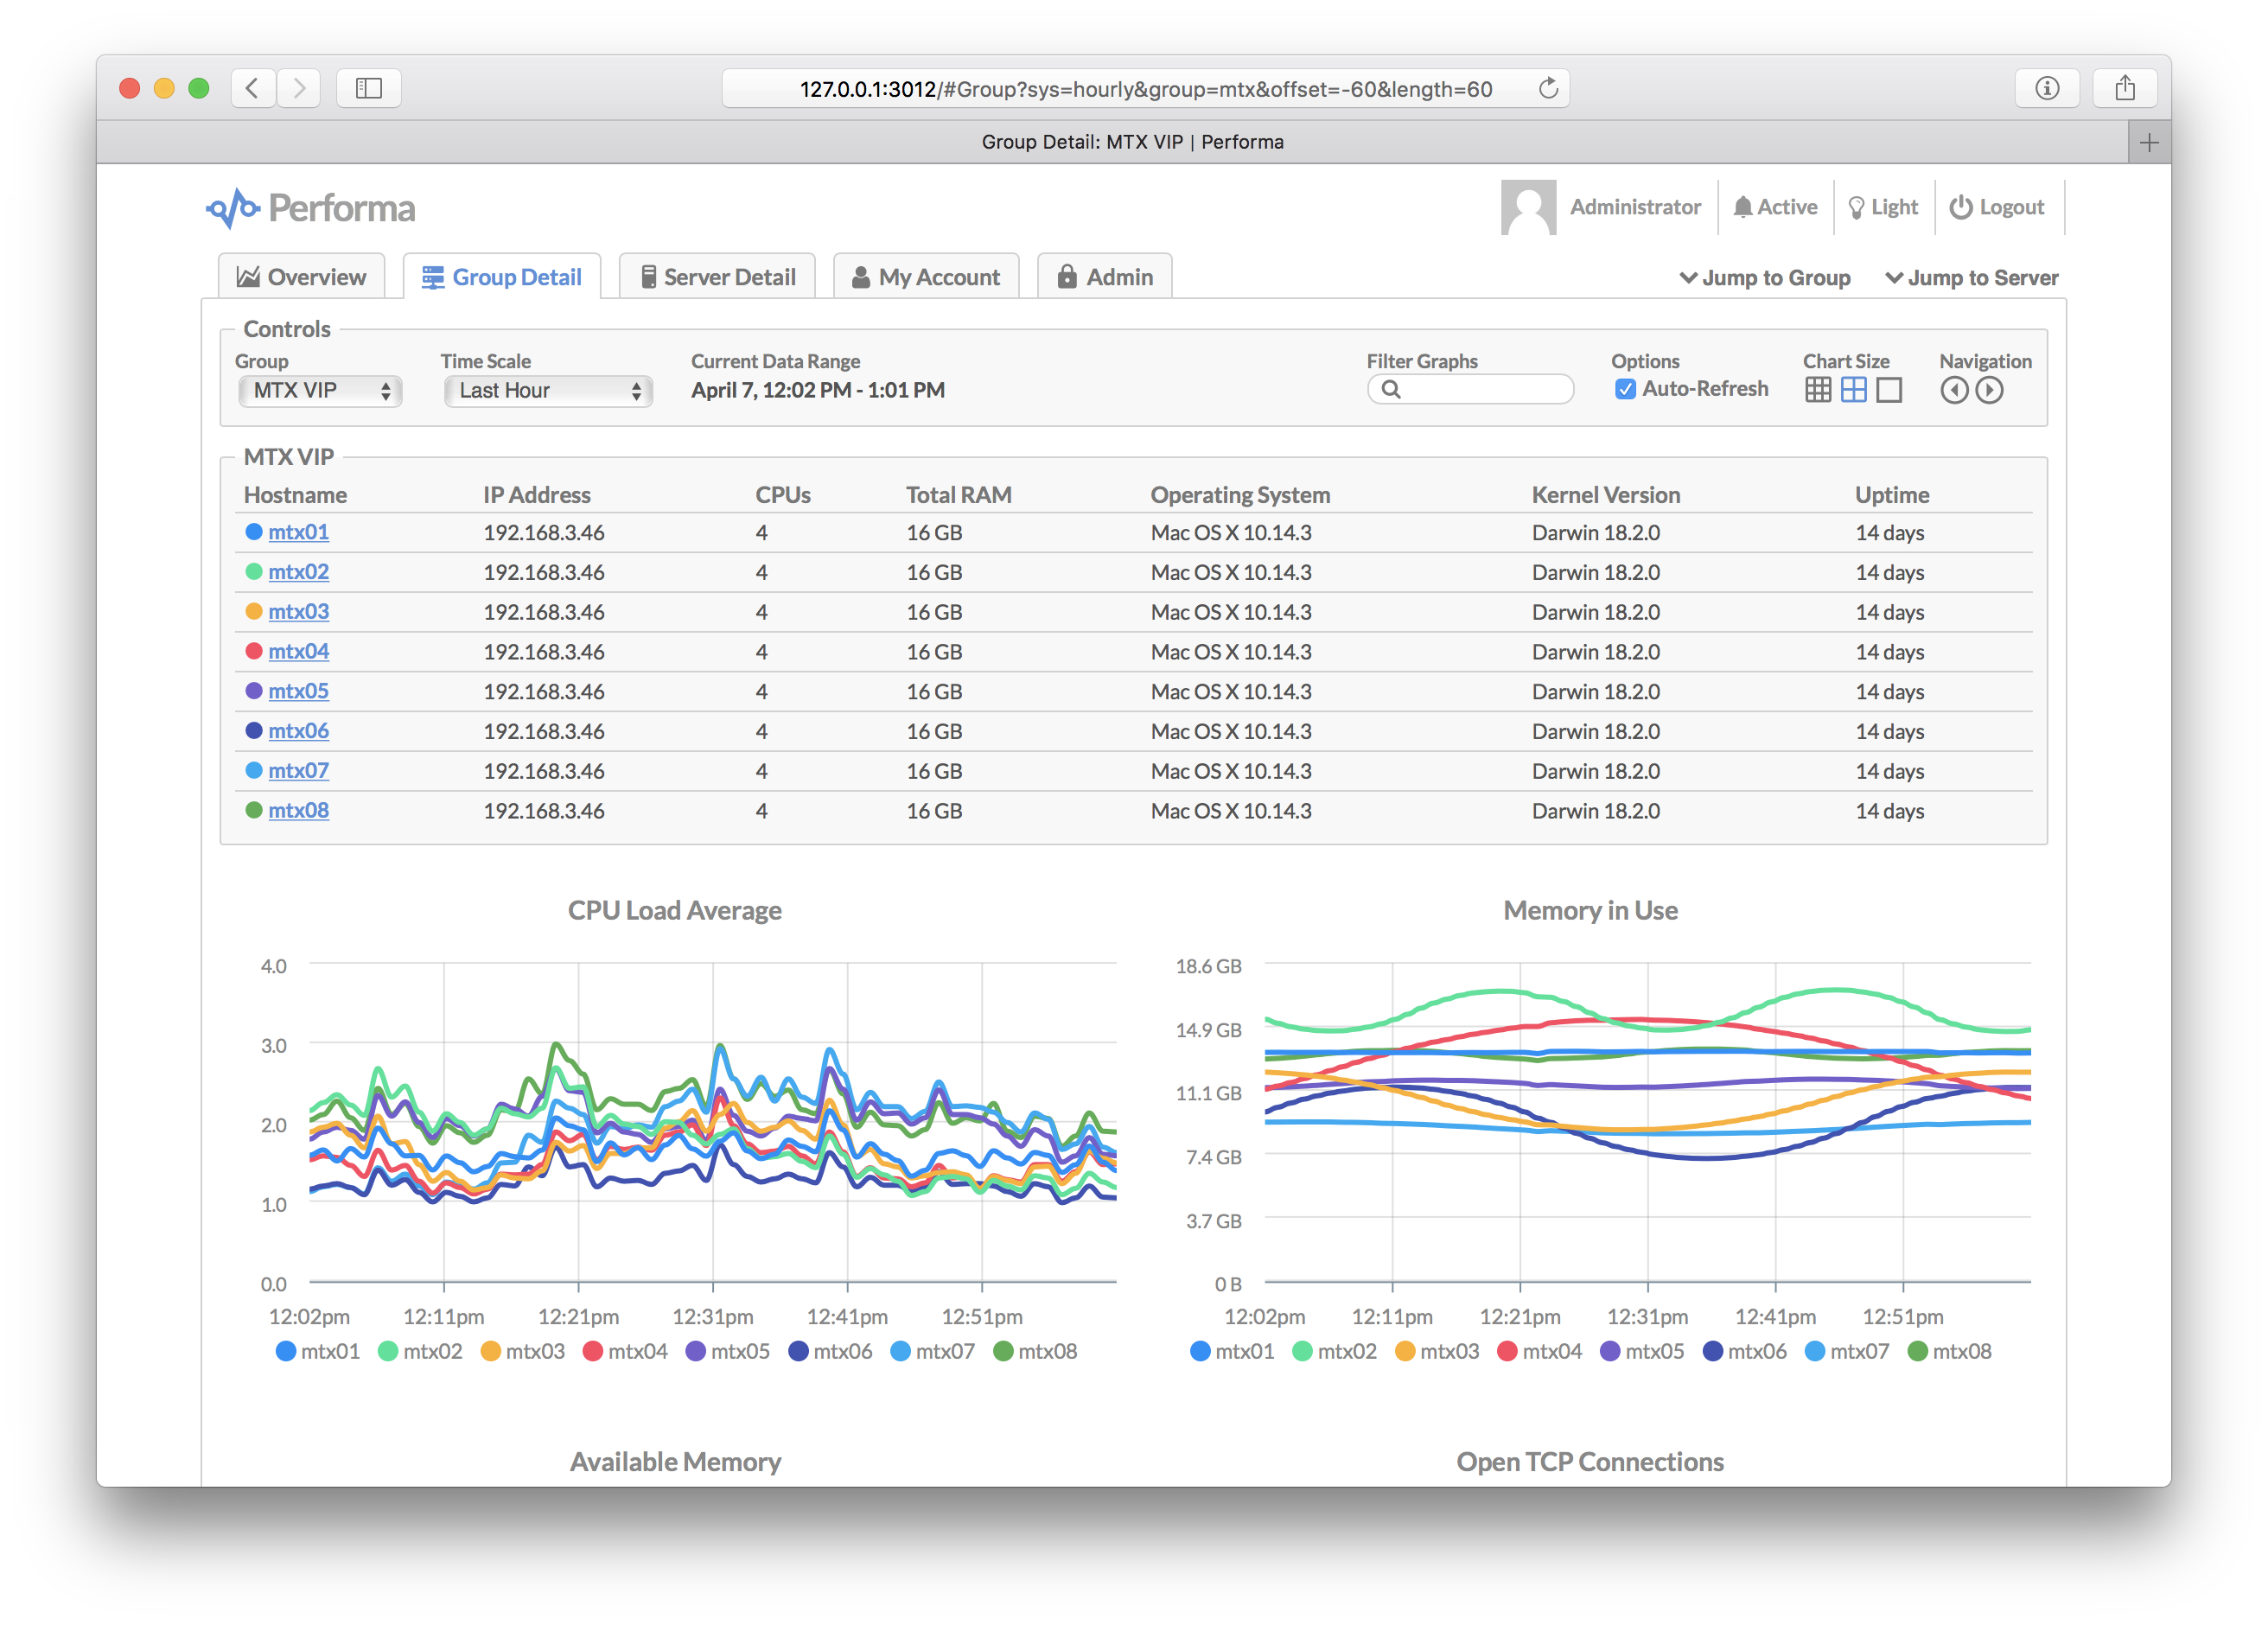
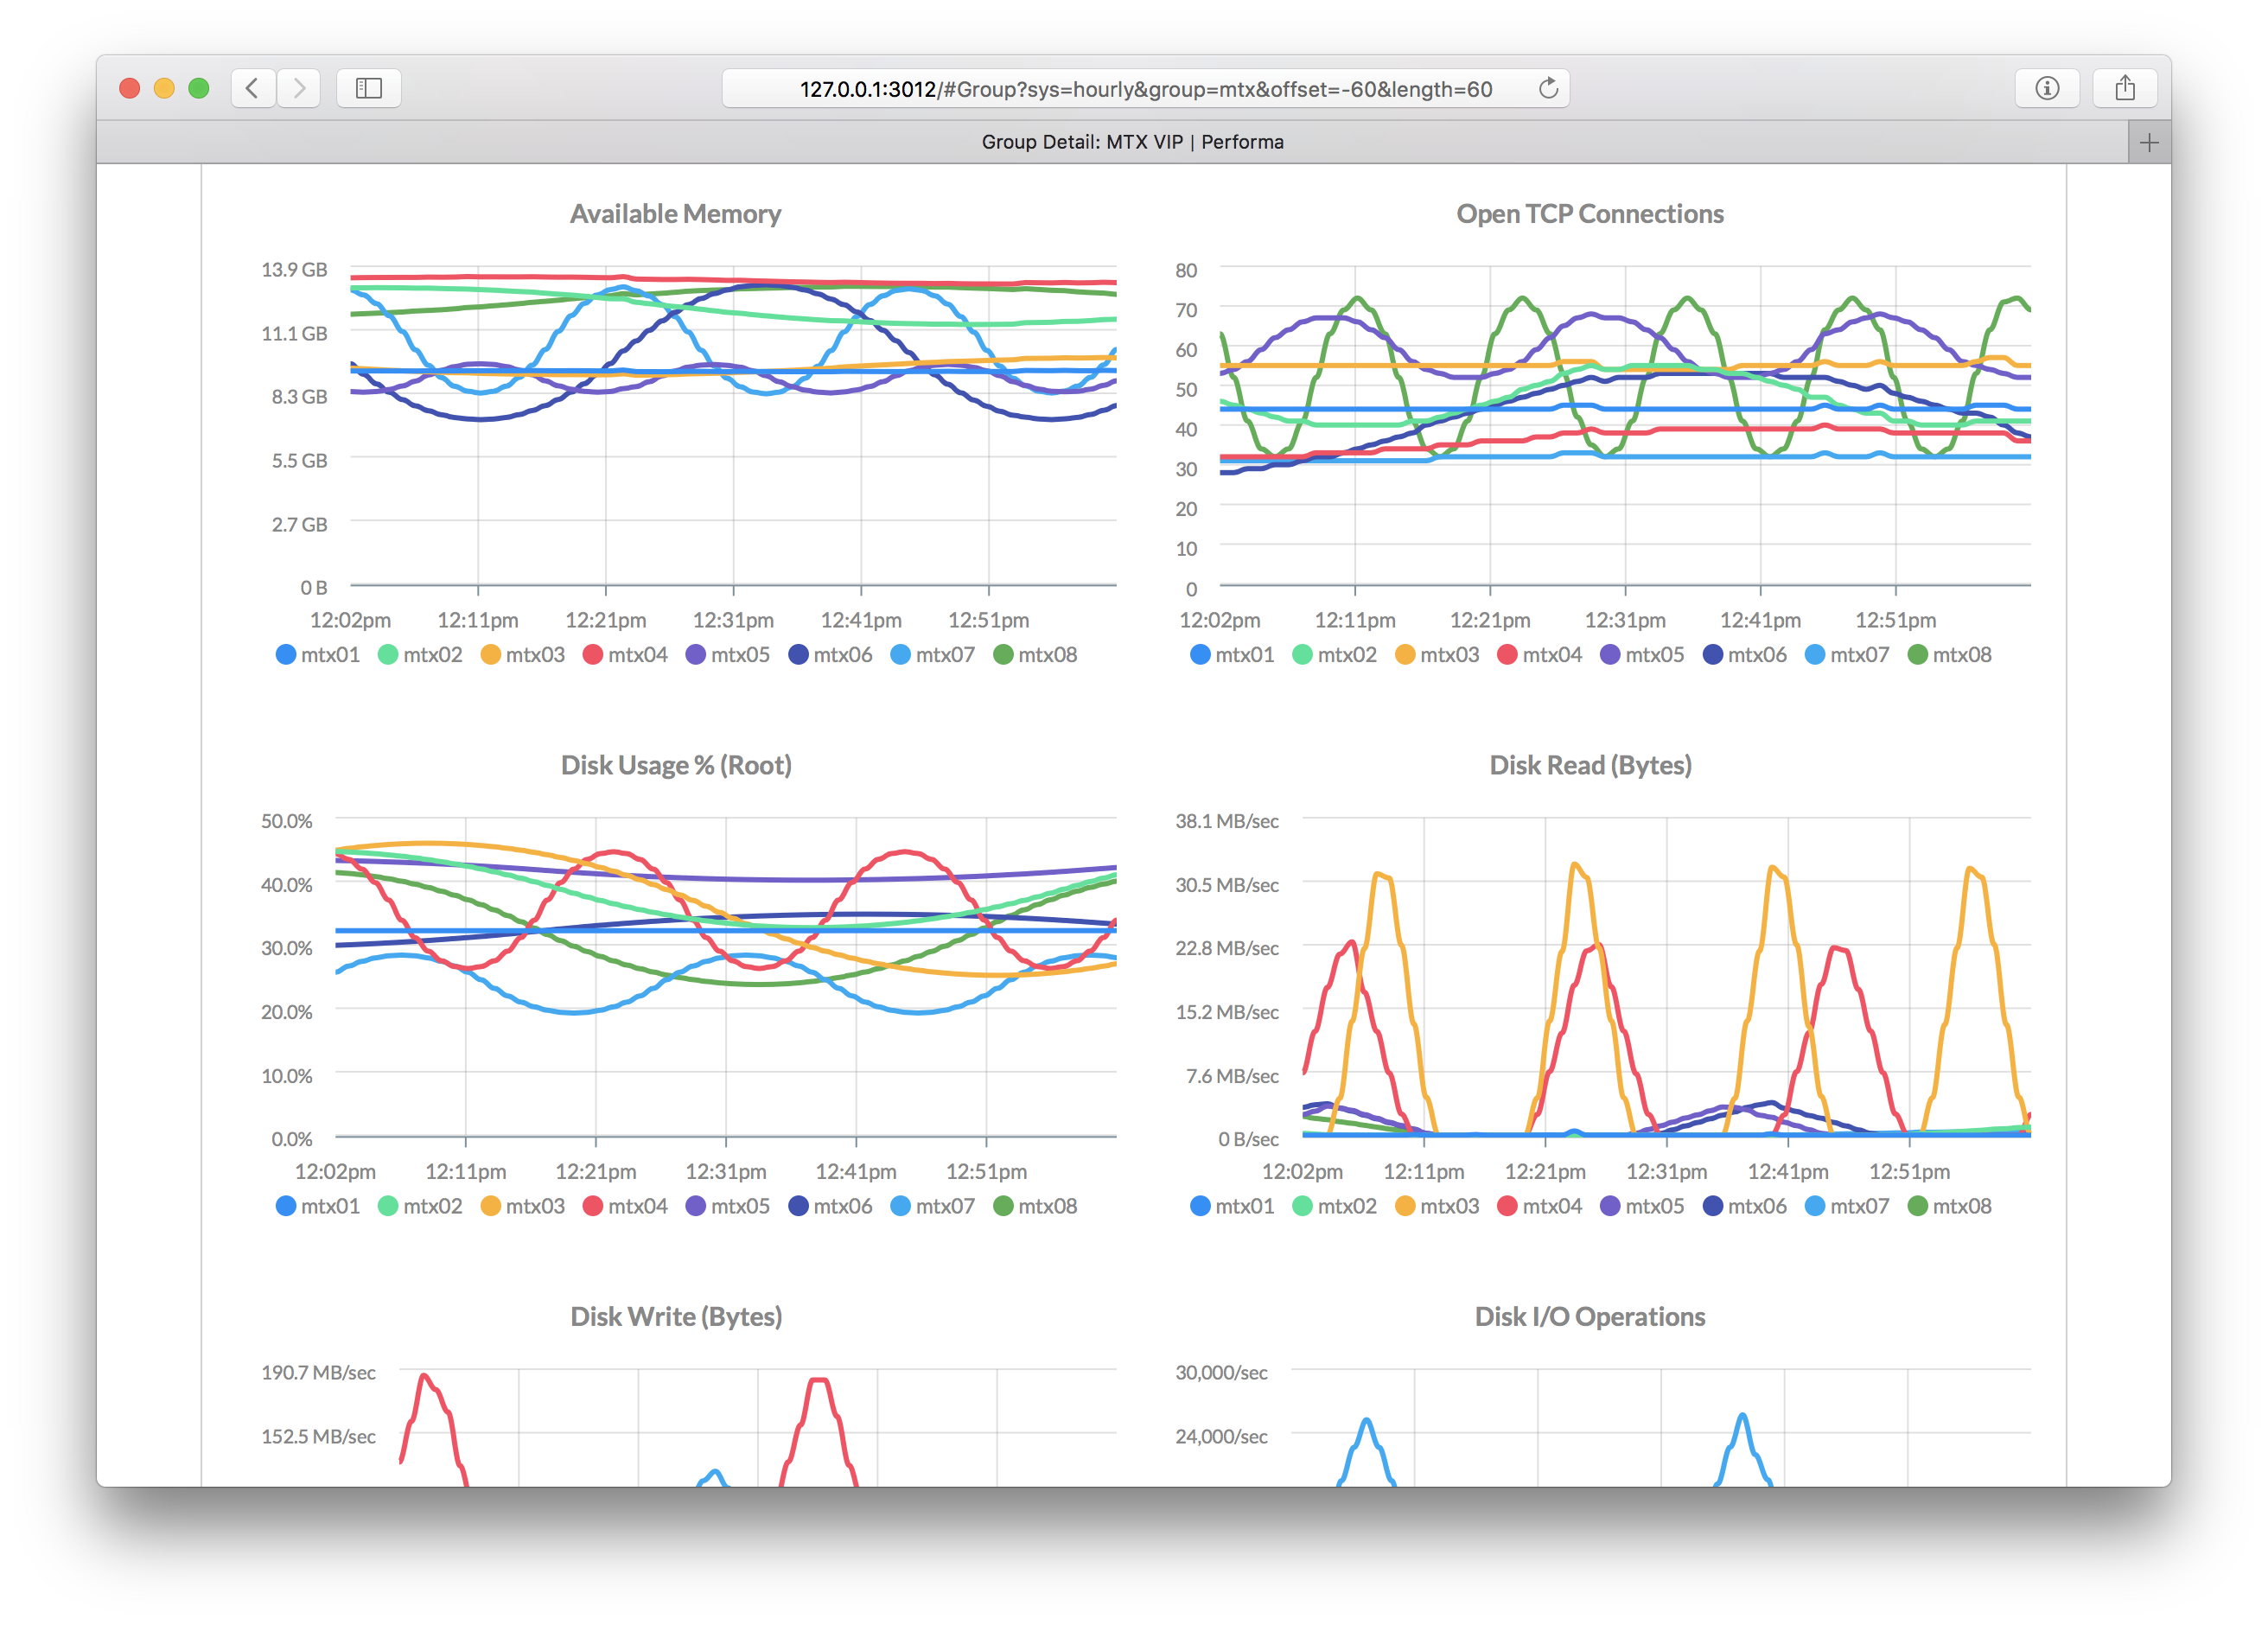
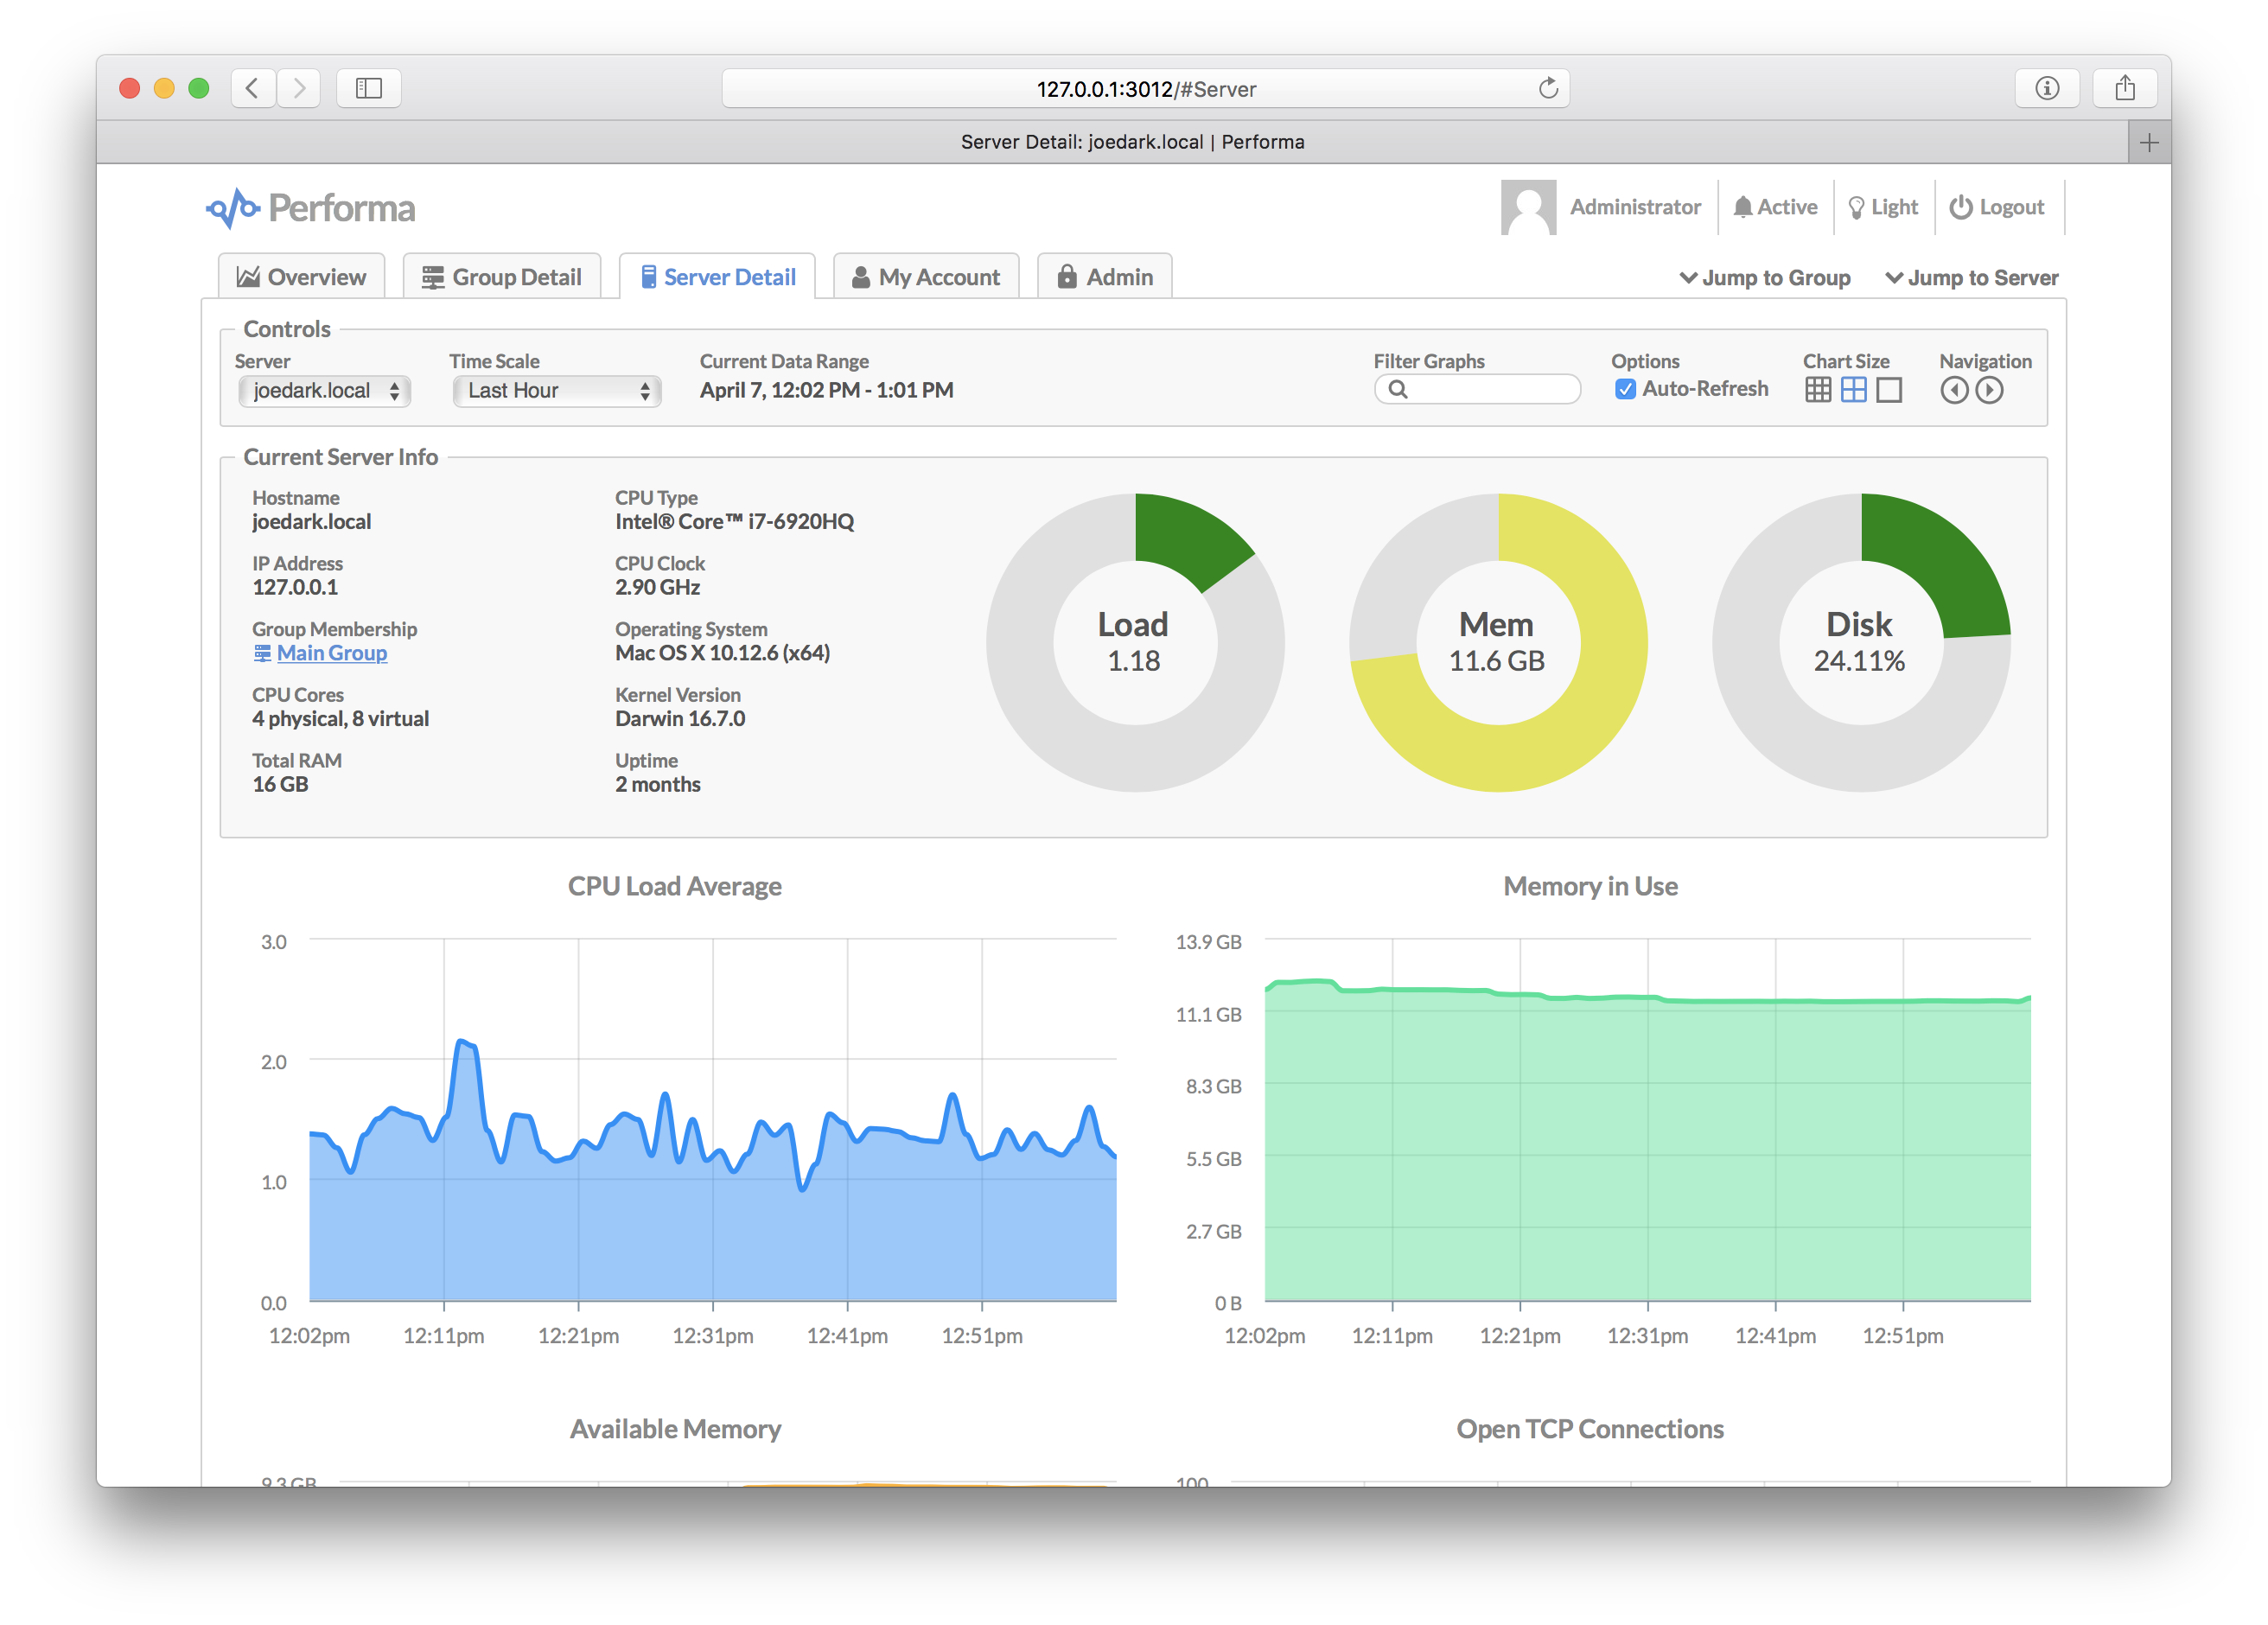
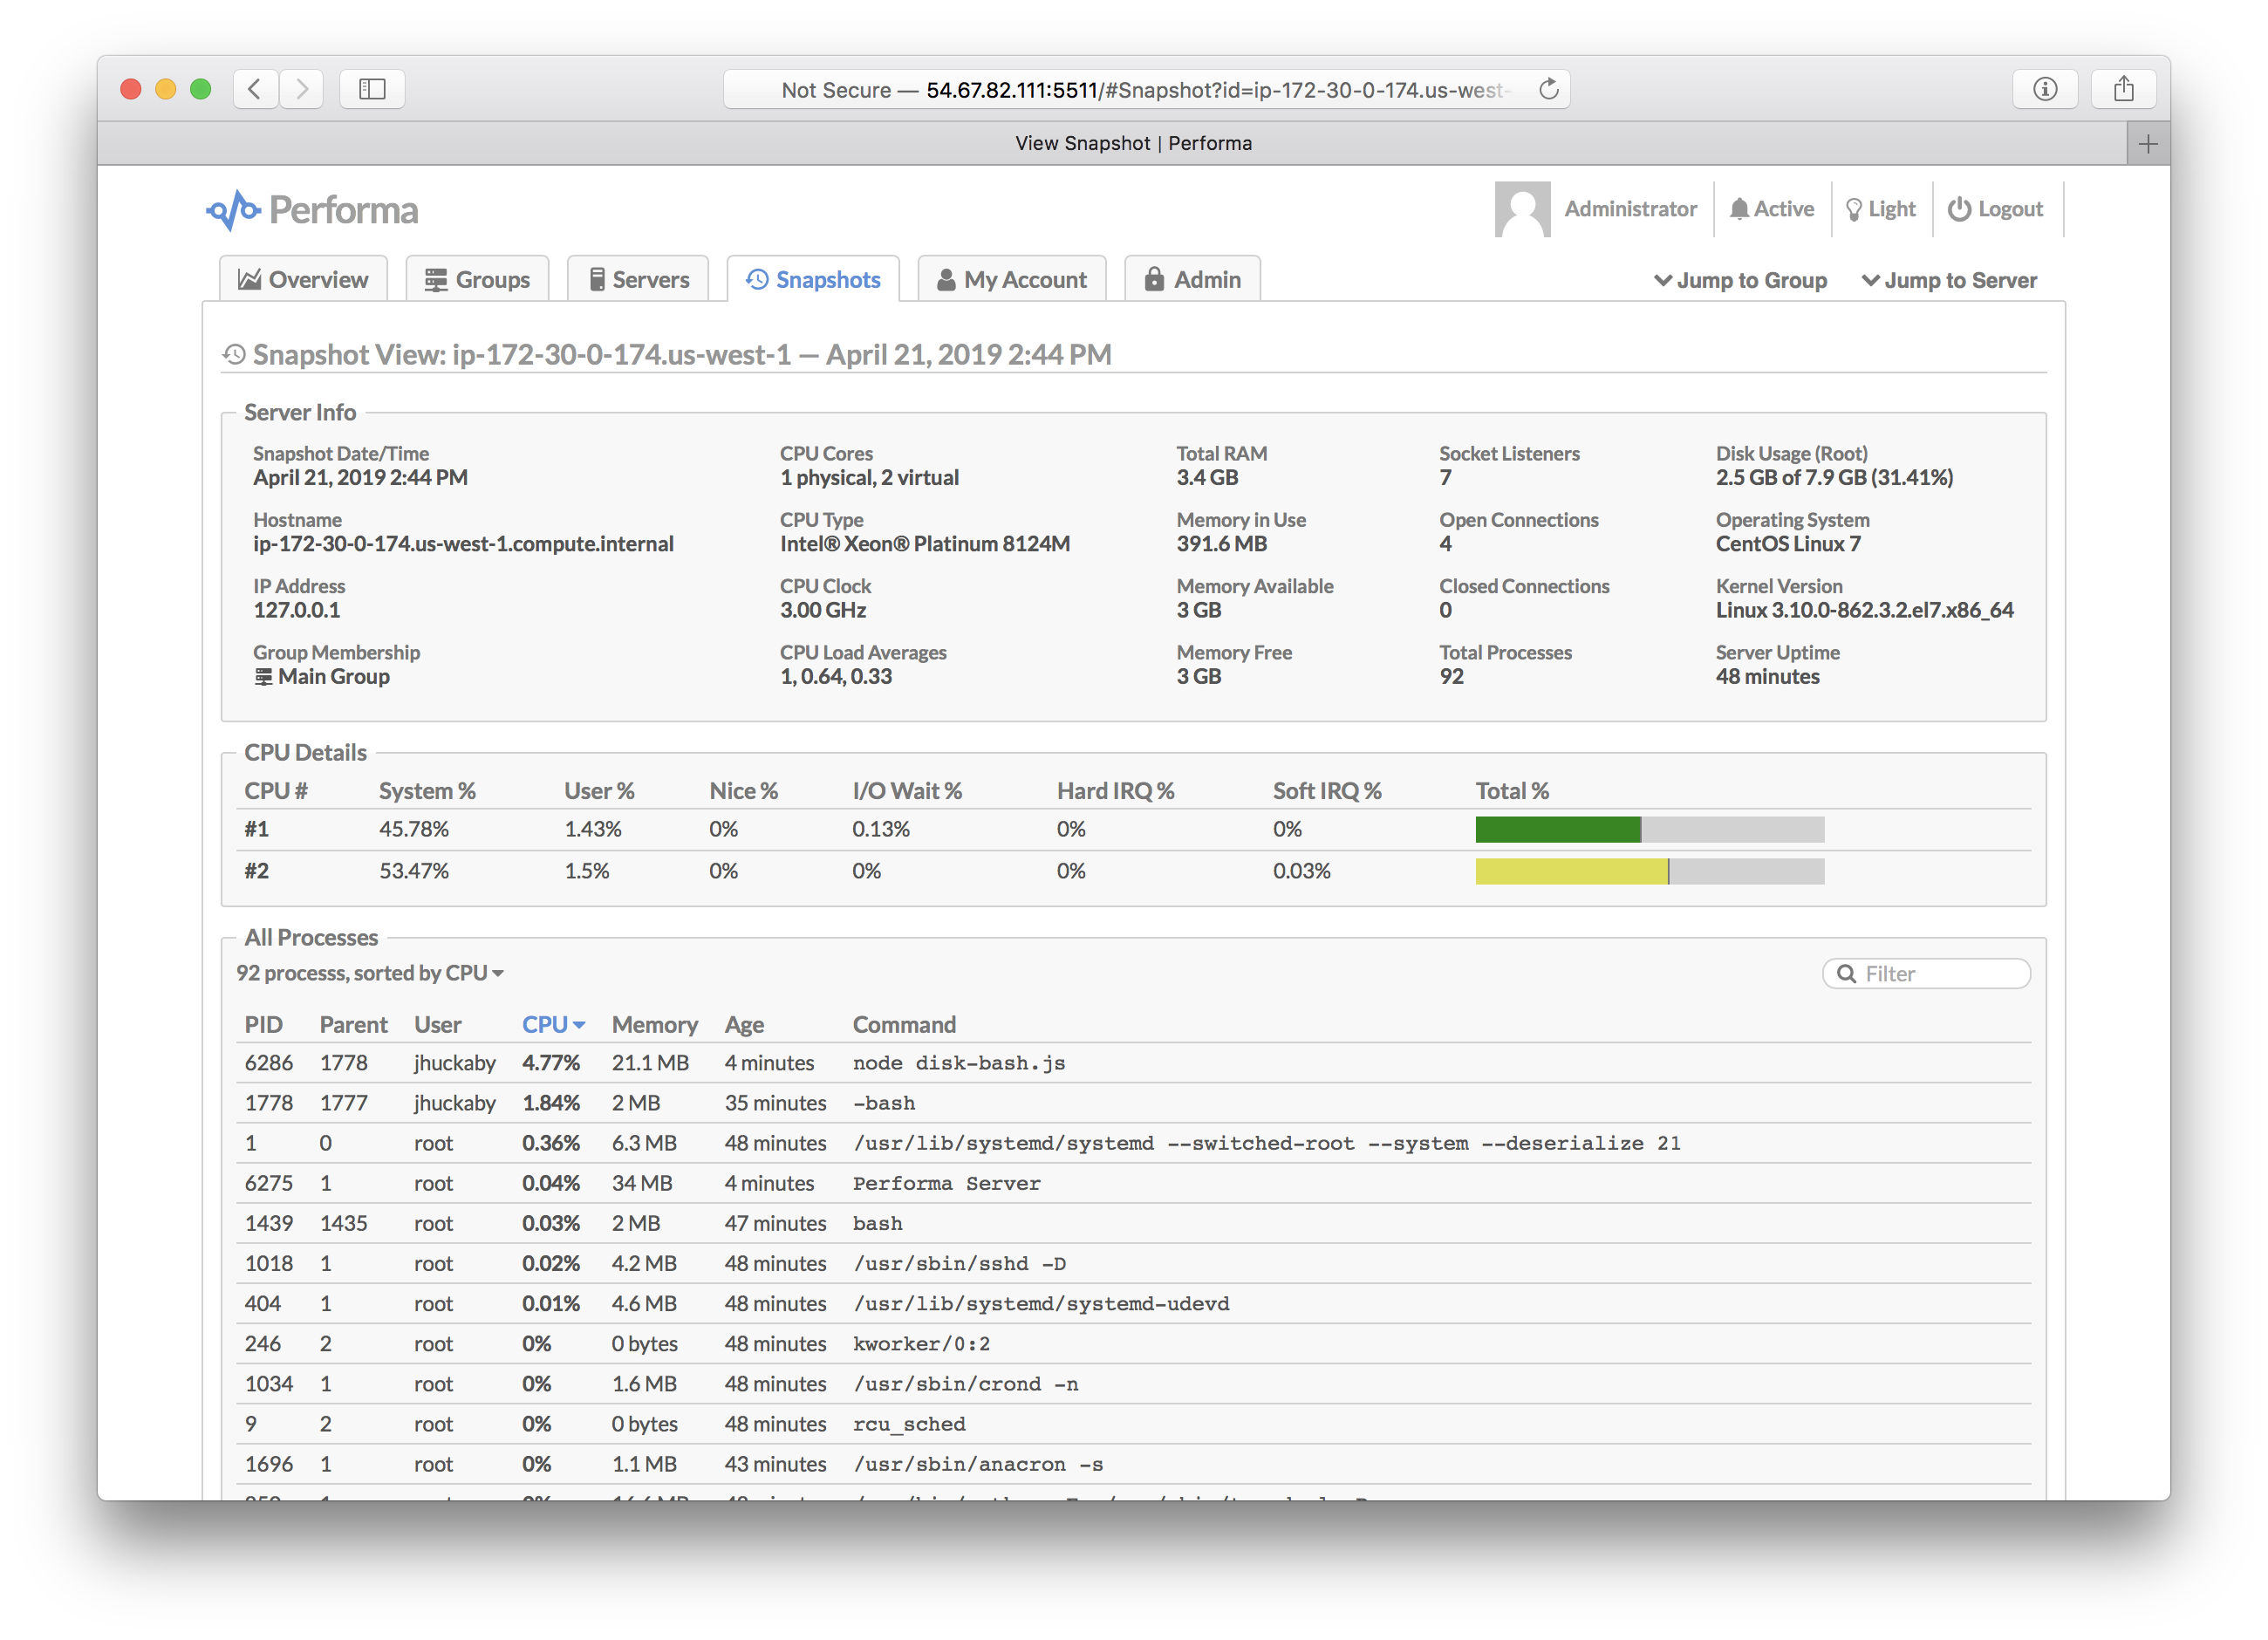
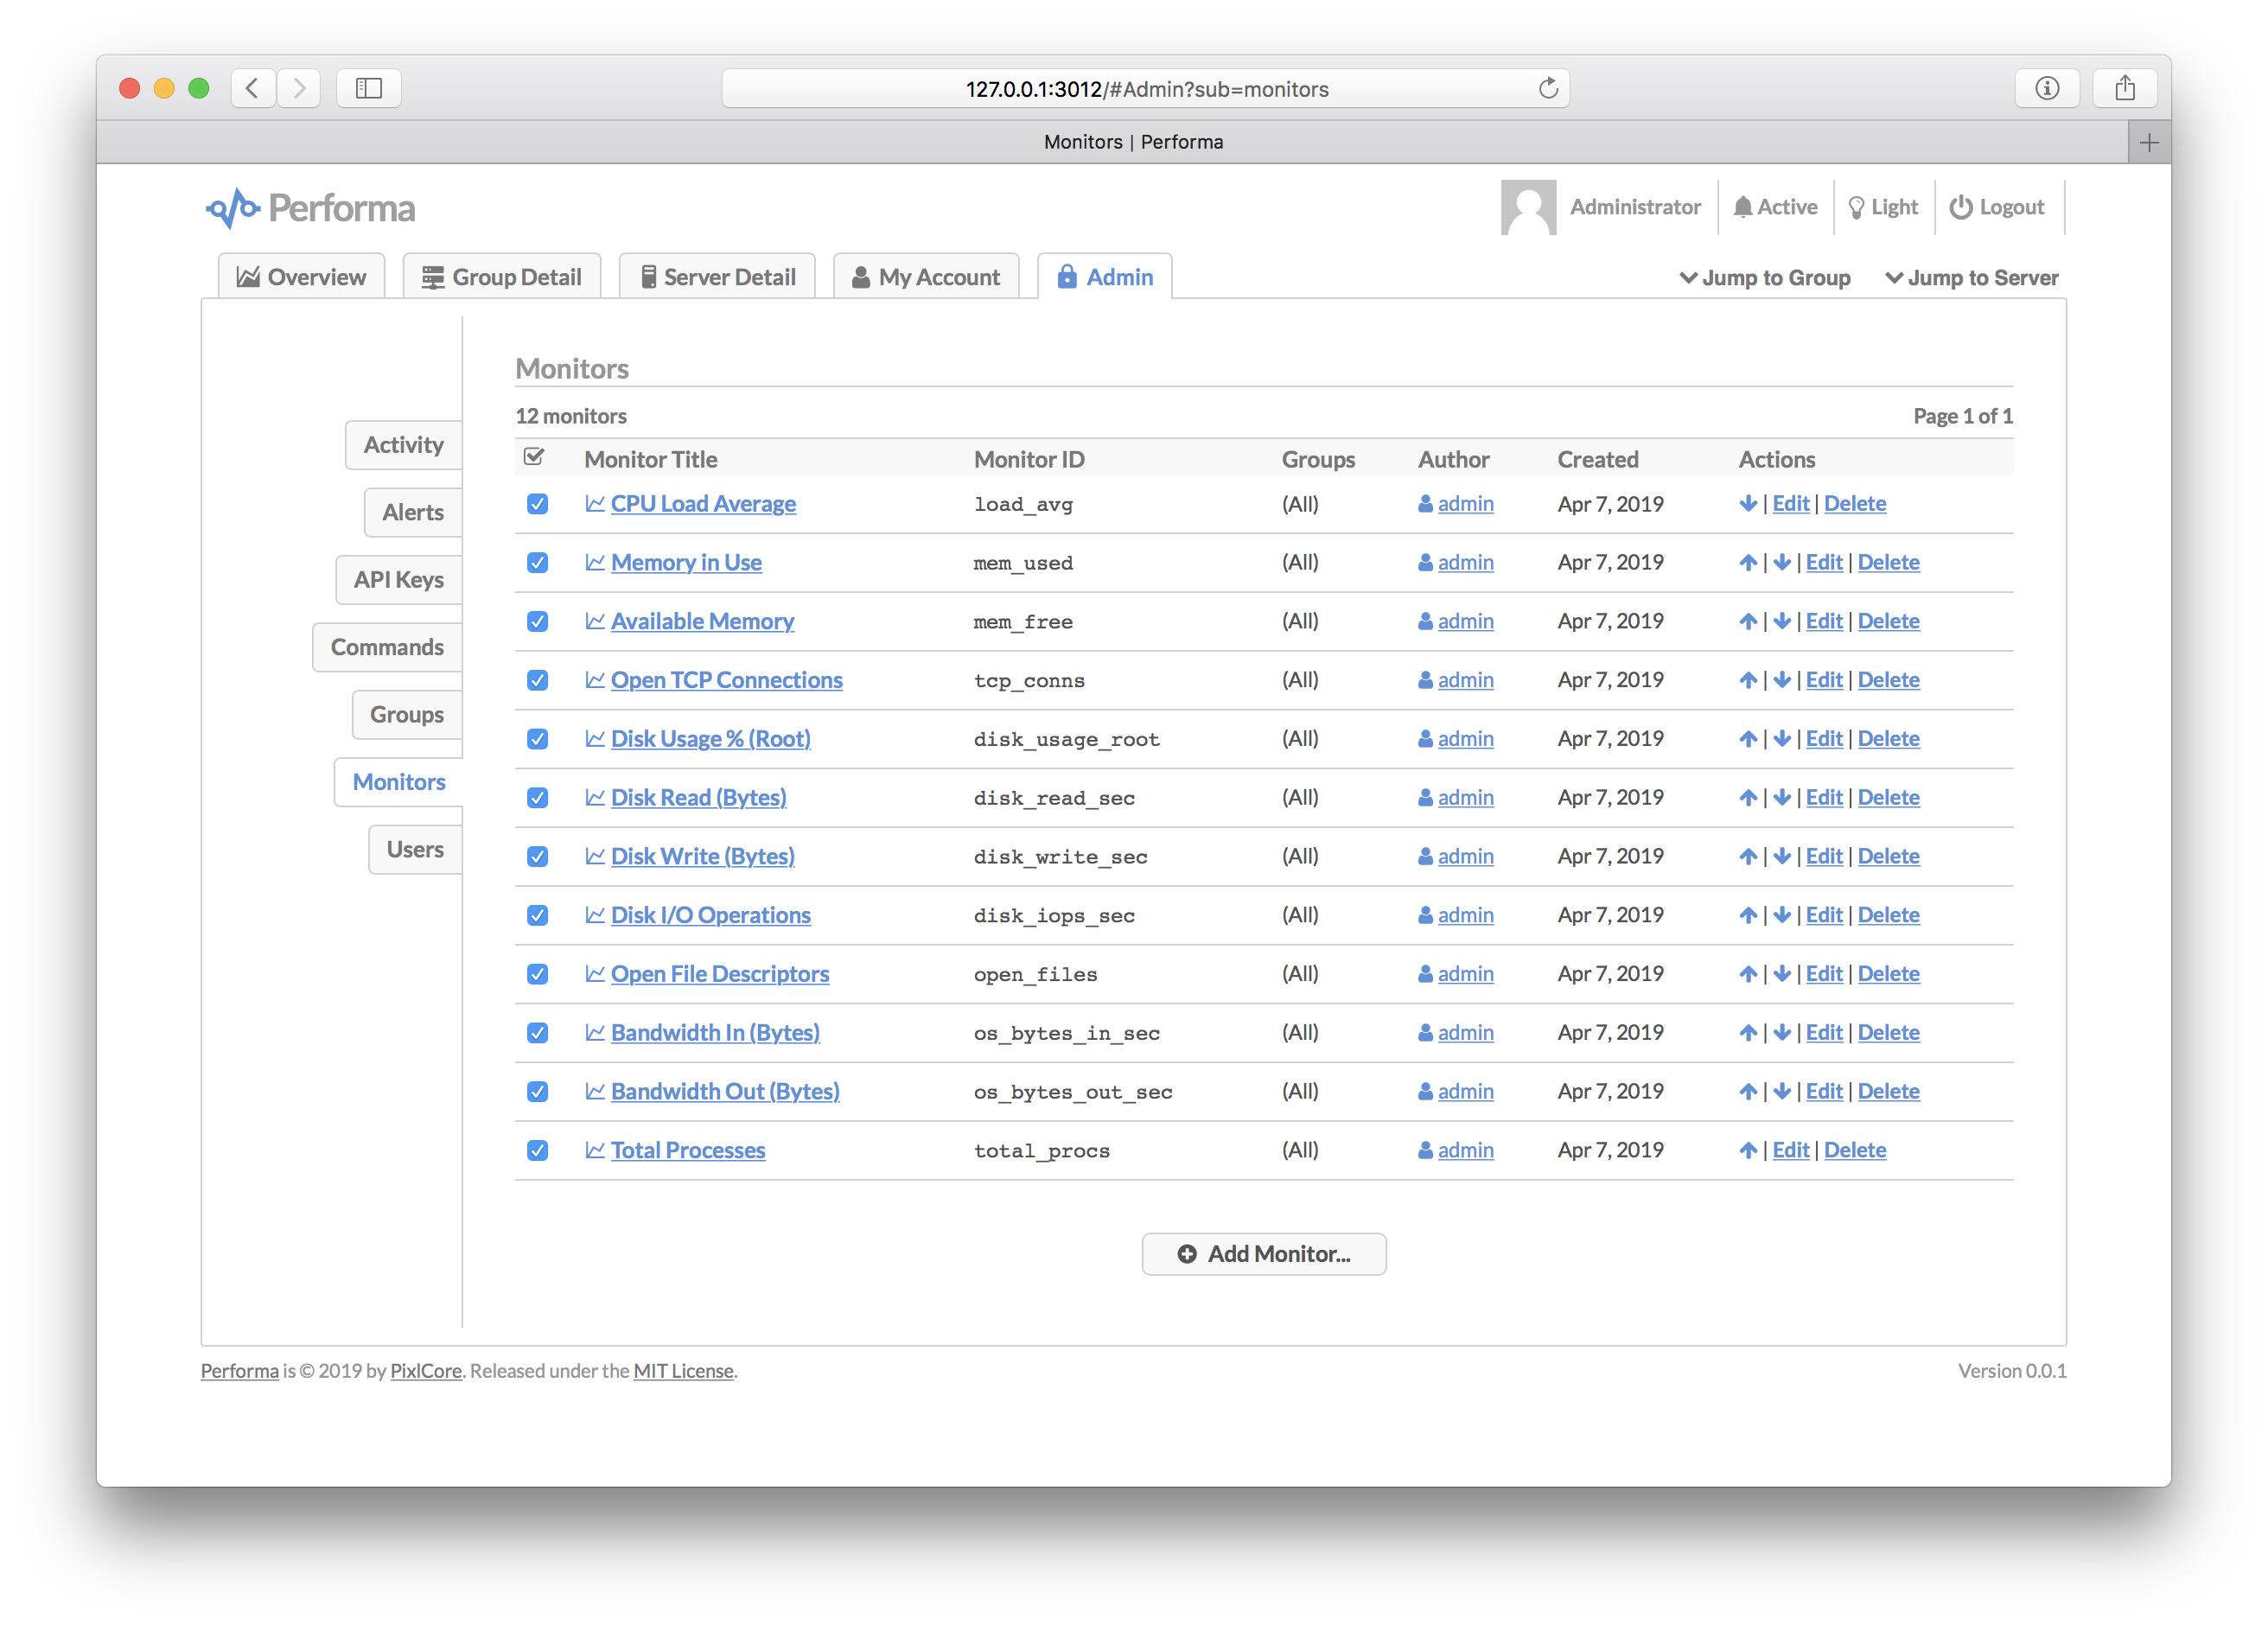
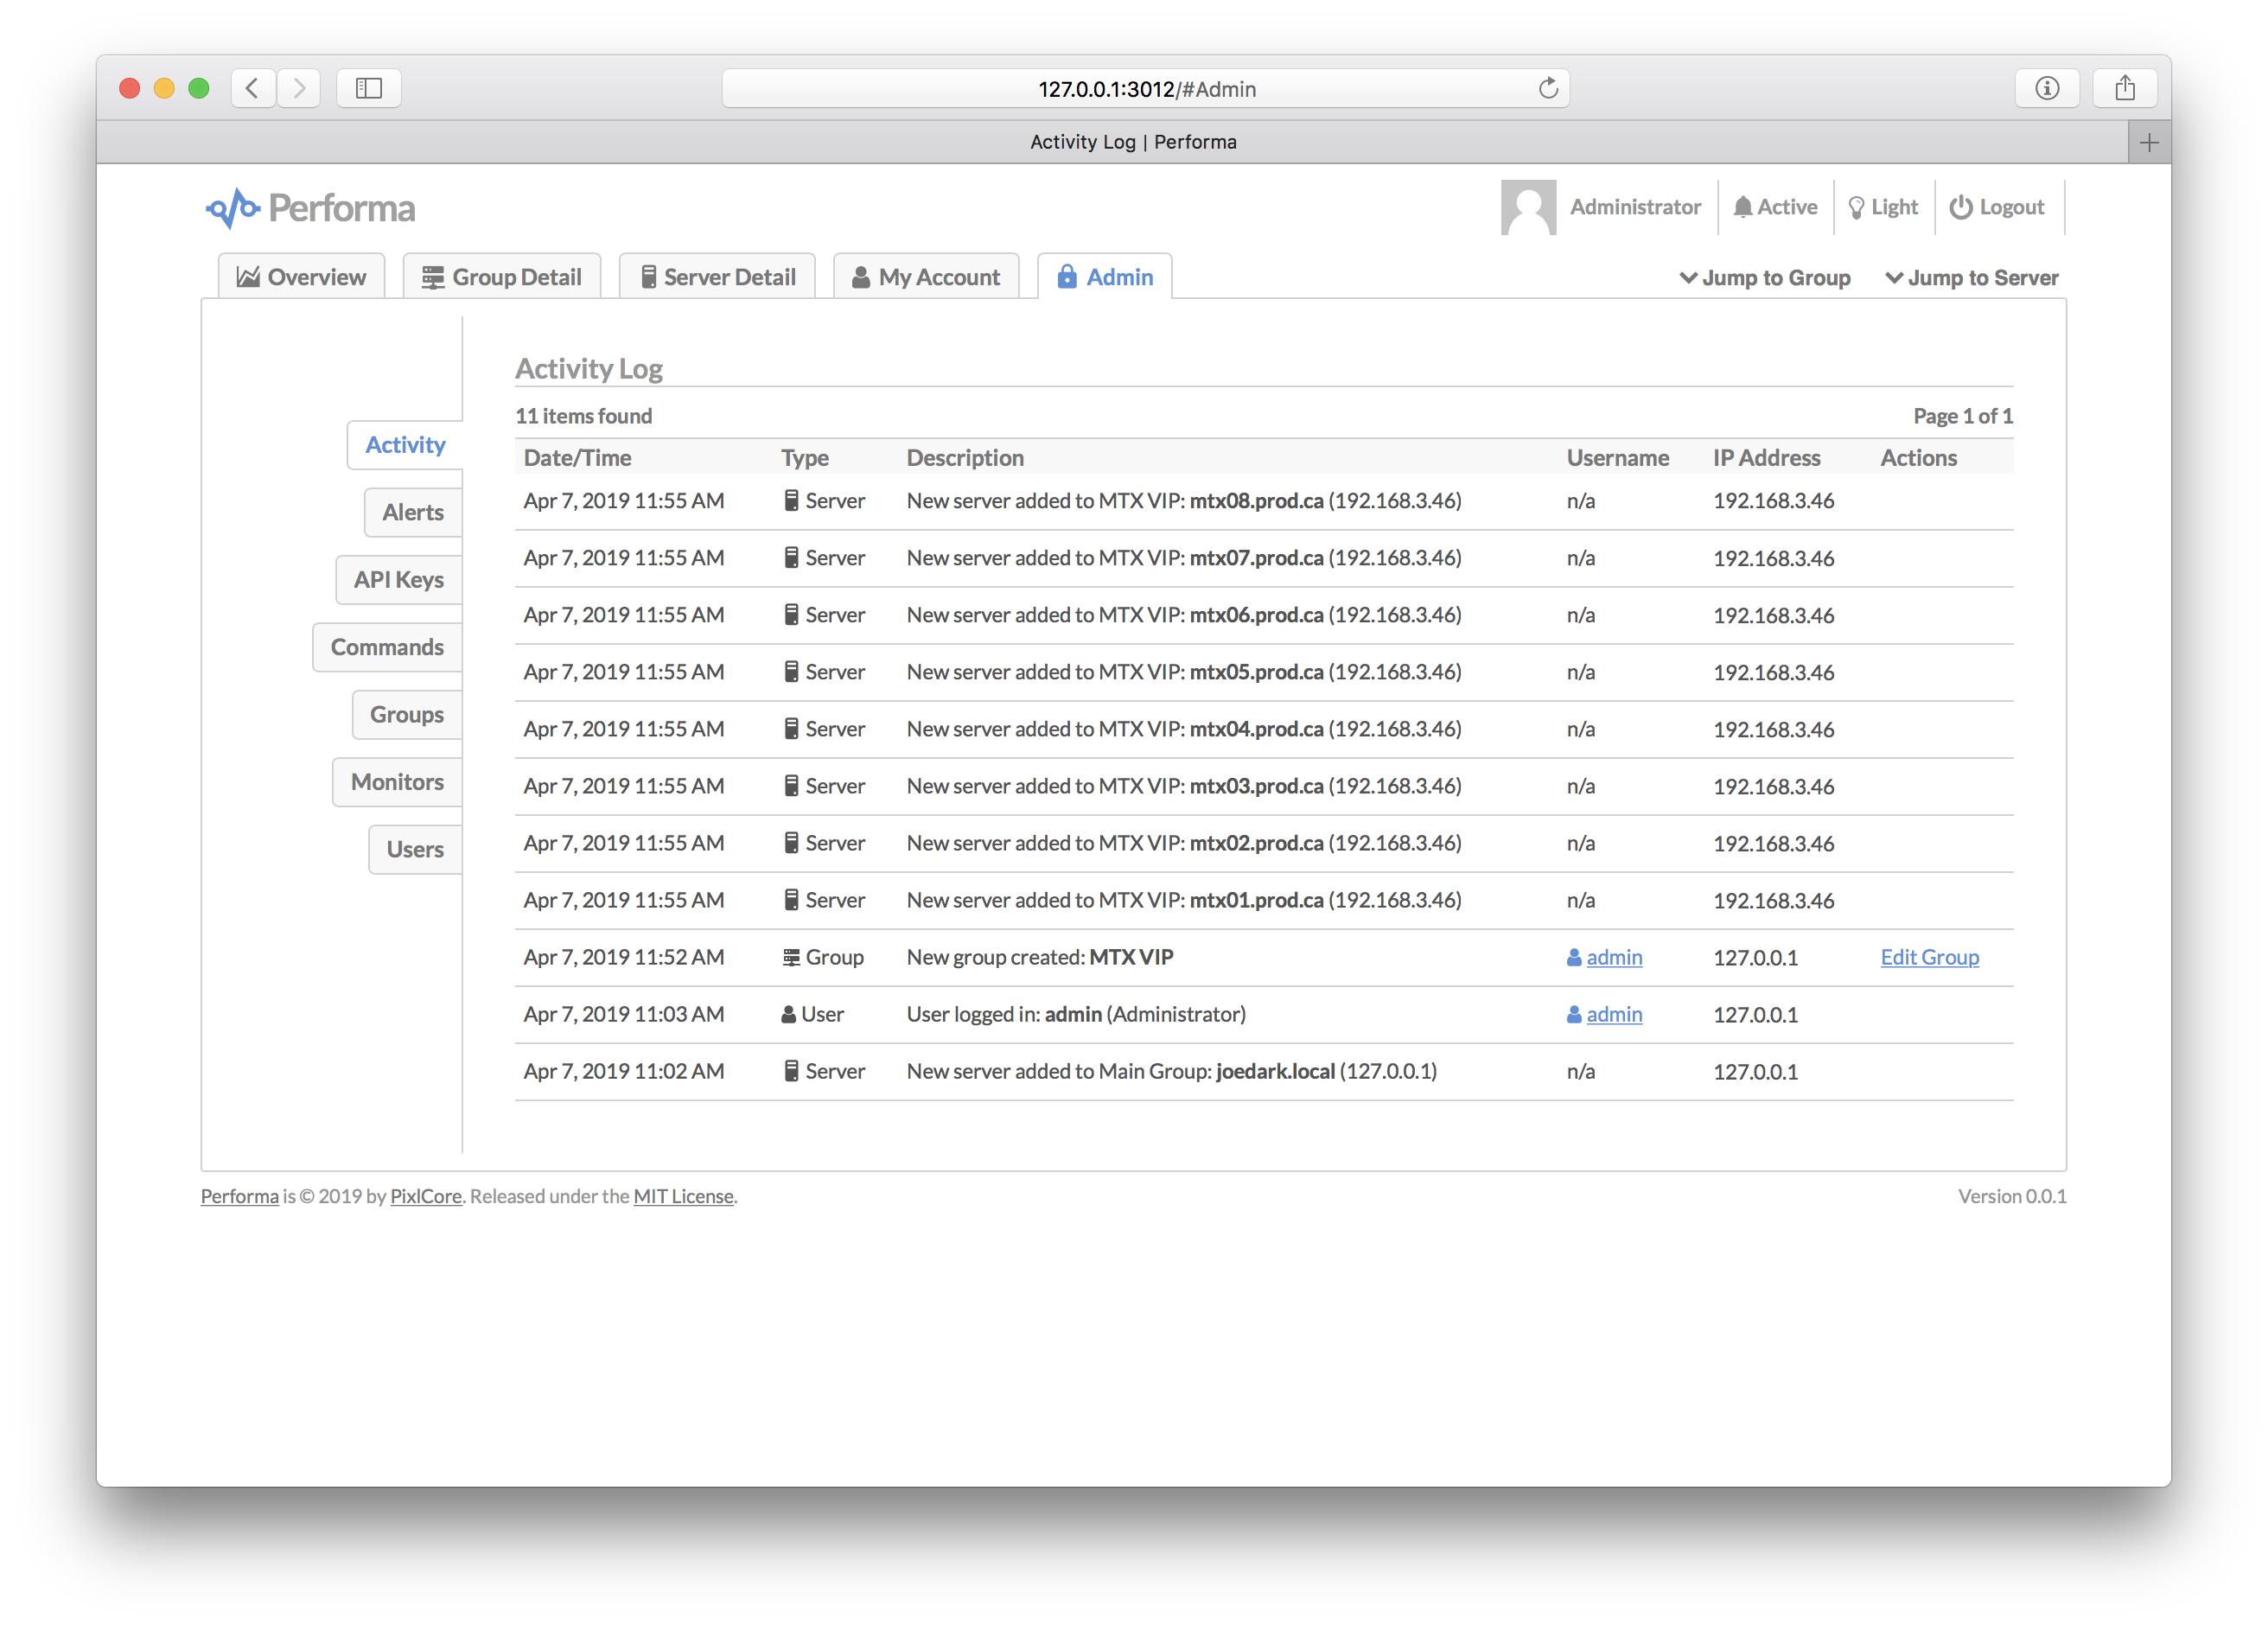
Screenshots
<details><summary>See Screenshots</summary>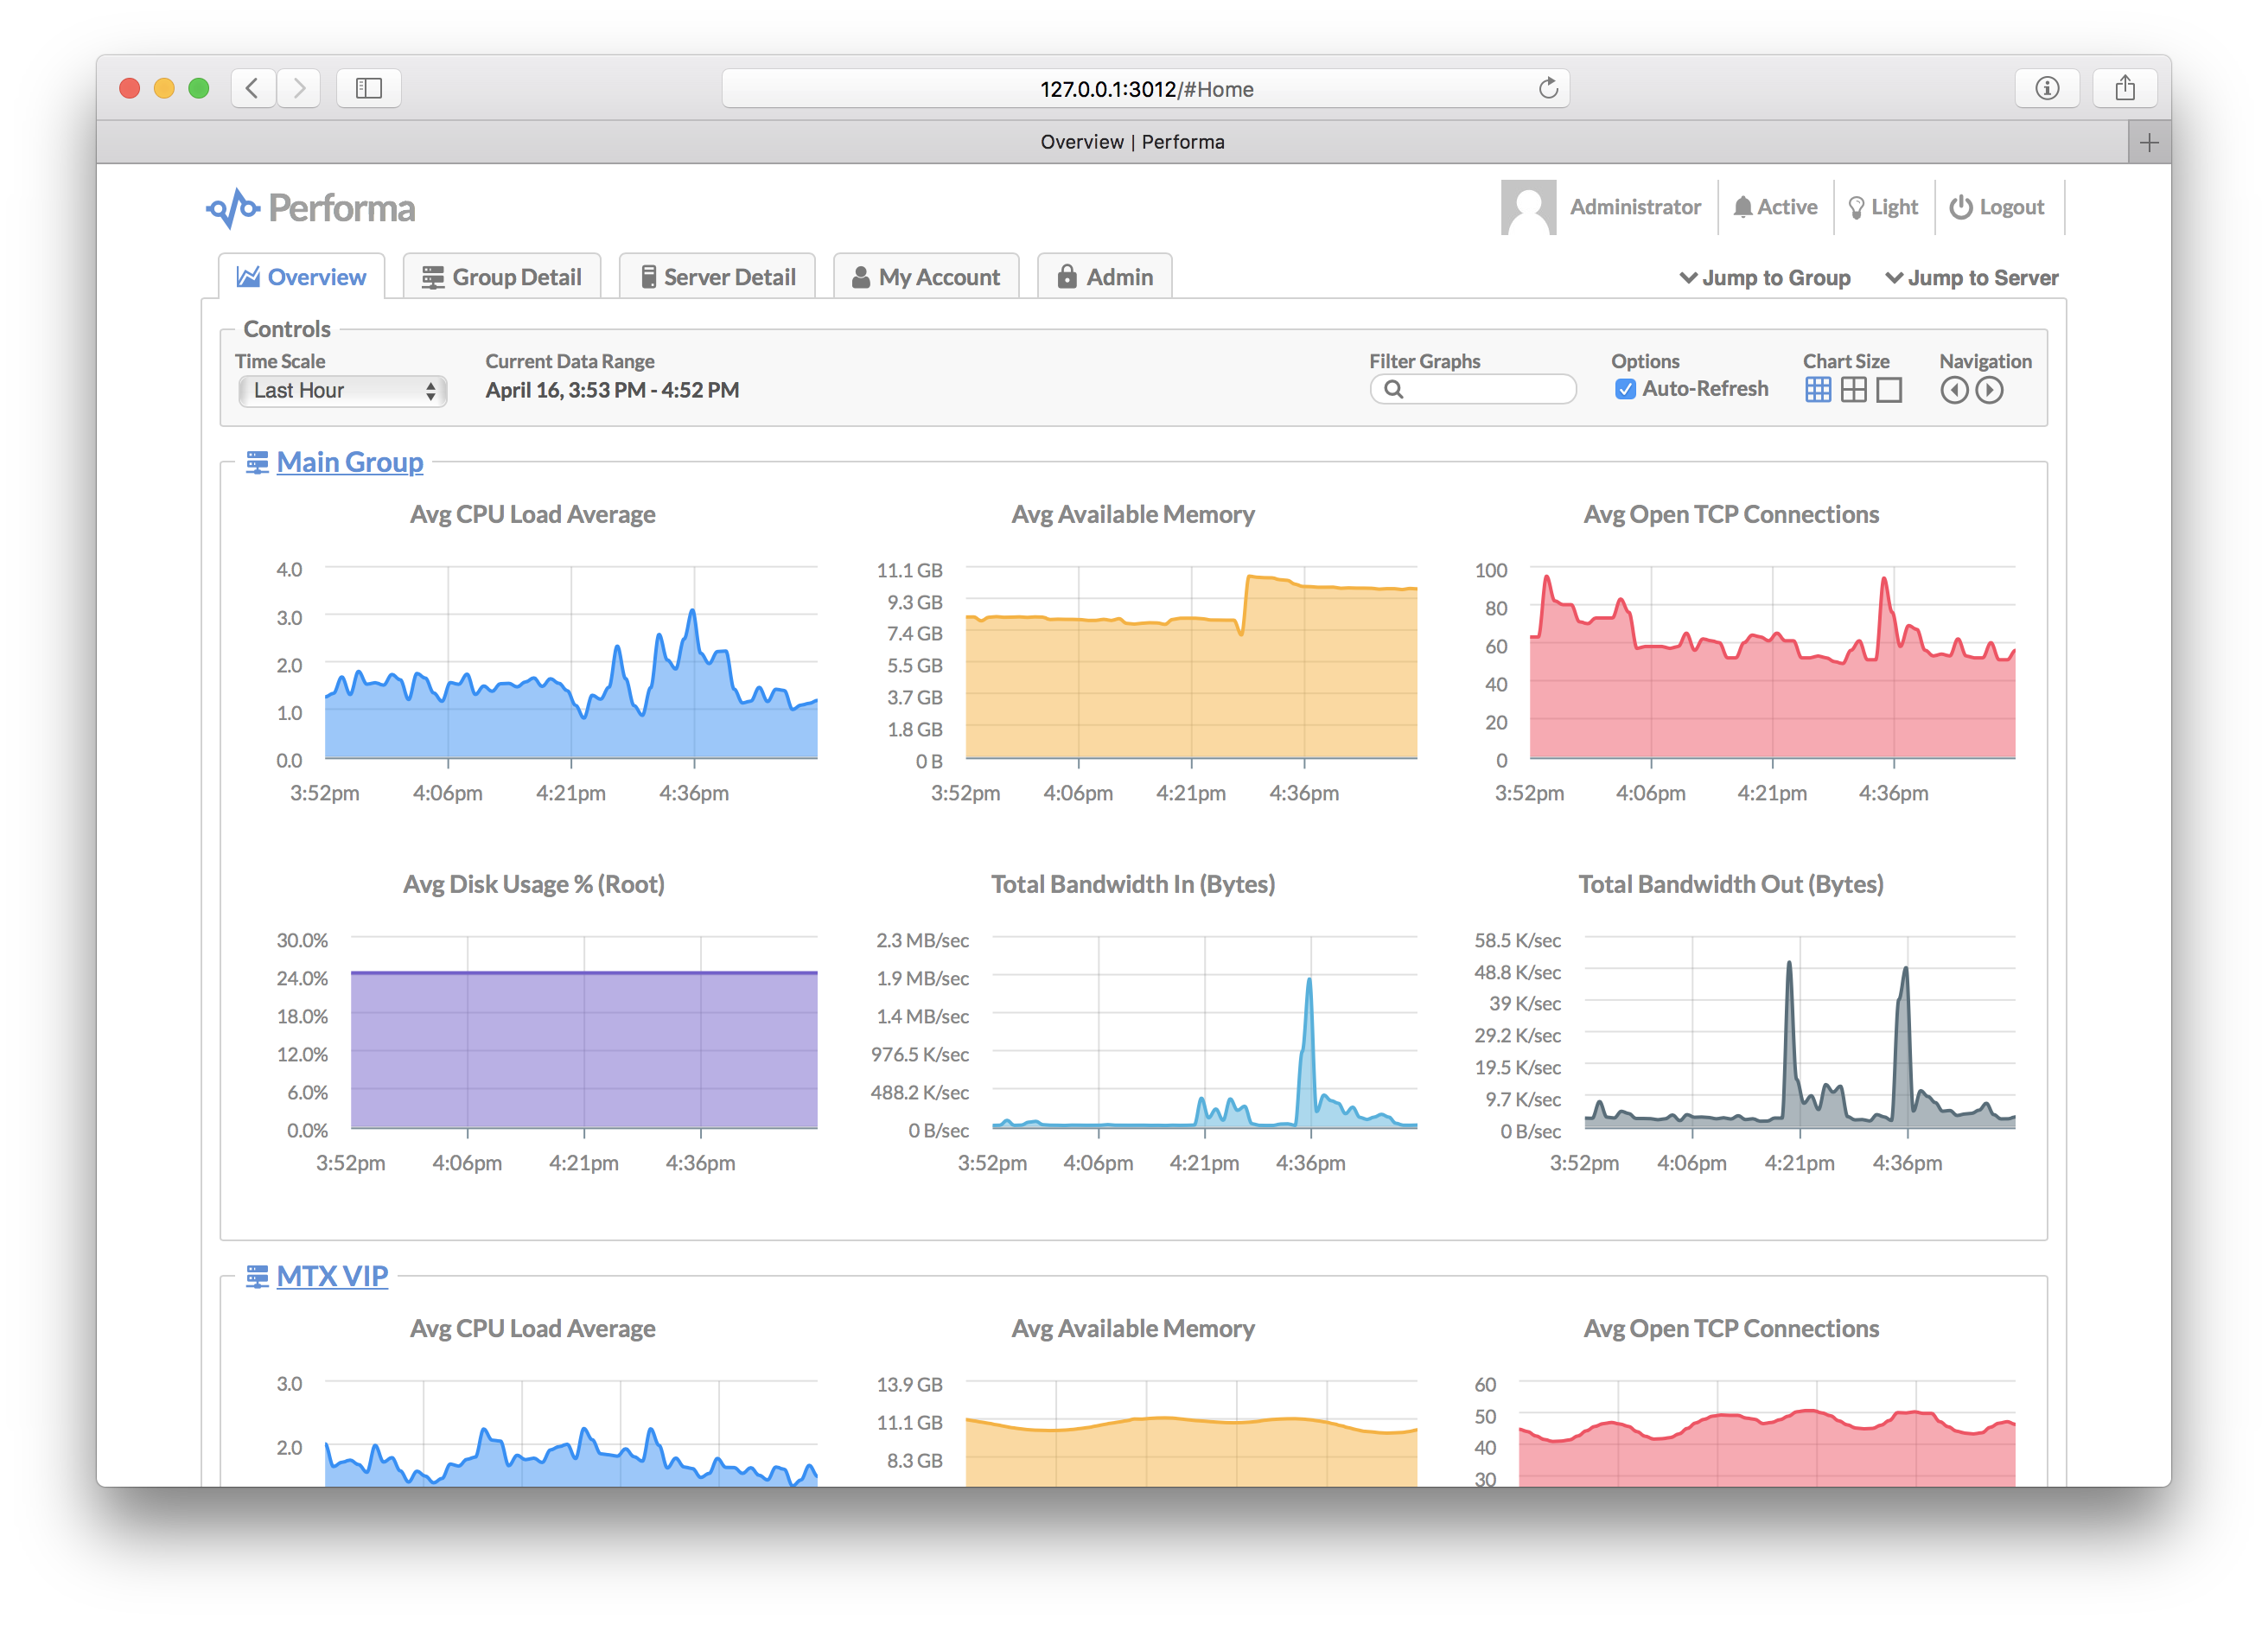
Glossary
A quick introduction to some common terms used in Performa:
| Term | Description |
|---|---|
| Group | A named group of servers which can be targeted by monitors, alerts and/or commands. A server can join a group either by hostname pattern, or explicitly when submitting metrics. See Groups below. |
| Monitor | A monitor is a single graph, which plots a single metric (number) over time, sent in from one or more servers. See Monitors below. |
| Alert | An alert is a trigger that fires when a custom expression, usually involving one or more monitors, evaluates to true. Alerts can send e-mails or fire web hooks. See Alerts below. |
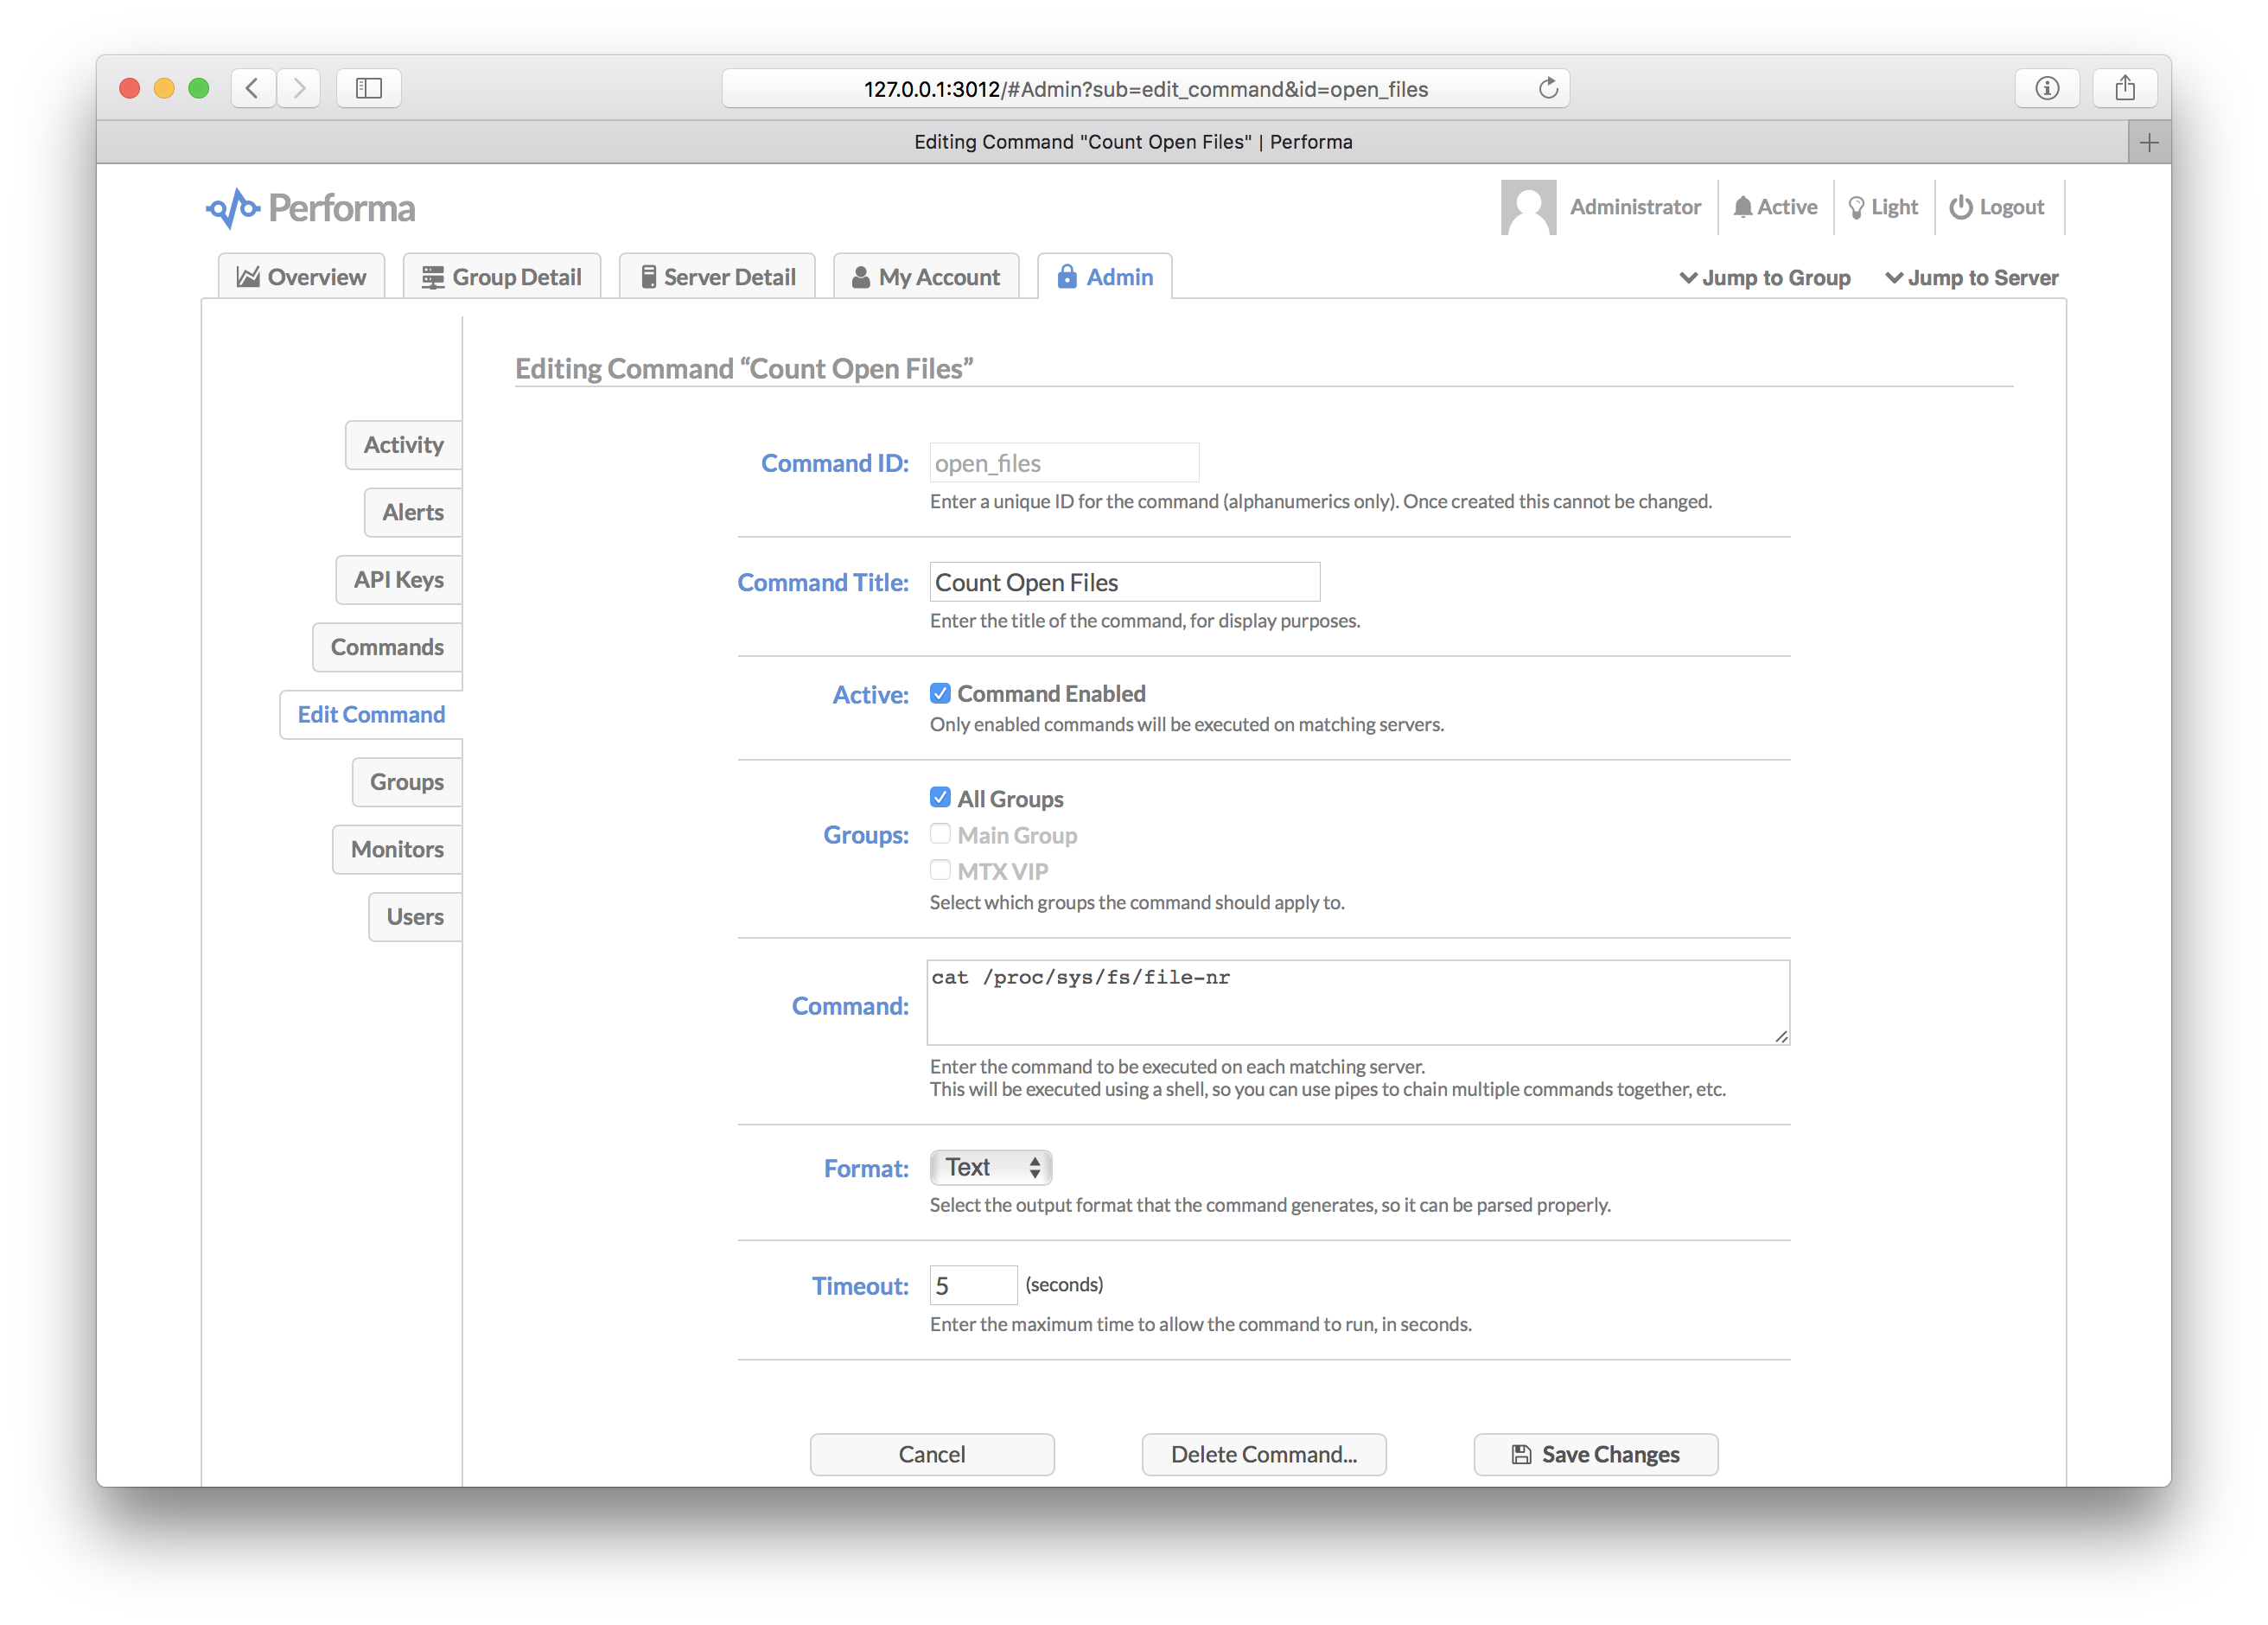
| Command | A command is a custom shell script (or Node, Perl, Python, etc.) that runs on your servers via Performa Satellite, and sends metrics back to the master server. See Commands below. |
| API Key | A special key that can be used by external apps to send API requests into Performa. |
| User | A human user account, which has a username and a password. Passwords are salted and hashed with bcrypt. |
| Satellite | Our headless companion product, which silently collects metrics on your servers and sends them to the master server. See Performa Satellite below. |
| Snapshot | A snapshot is a detailed record of everything happening on a server, including all processes and network sockets. Snapshots are taken when alerts trigger, and when being watched. See Snapshots below. |
Installation
Please note that Performa currently only works on POSIX-compliant operating systems, which basically means Unix/Linux and macOS. If there is enough interest, I'll look into making it work on Windows.
You'll need to have Node.js pre-installed on your master server (you do not need this on any of the servers you are monitoring however). Then become root and type this:
curl -s https://raw.githubusercontent.com/jhuckaby/performa/master/bin/install.js | node
This will install the latest stable release of Performa and all of its dependencies under: /opt/performa/
If you'd rather install it manually (or something went wrong with the auto-installer), here are the raw commands:
mkdir -p /opt/performa
cd /opt/performa
curl -L https://github.com/jhuckaby/performa/archive/v1.0.0.tar.gz | tar zxvf - --strip-components 1
npm install
node bin/build.js dist
Replace v1.0.0 with the desired Performa version from the release list, or master for the head revision (unstable).
Setup
If this is your first time installing, please read the Configuration section first. You'll likely want to customize a few configuration parameters in the /opt/performa/conf/config.json file before proceeding. At the very least, you should set these properties:
| Key | Description |
|---|---|
base_app_url | A fully-qualified URL to Performa on your server, including the http_port if non-standard. This is used in e-mails to create self-referencing URLs. |
email_from | The e-mail address to use as the "From" address when sending out notifications. |
smtp_hostname | The hostname of your SMTP server, for sending mail. This can be 127.0.0.1 or localhost if you have sendmail running locally. |
secret_key | A secret key so you can monitor multiple servers. See secret_key below. |
http_port | The web server port number for the user interface. Defaults to 5511. |
Now then, the only other decision you have to make is what to use as a storage back-end. Performa can use local disk (easiest setup), Couchbase or Amazon S3.
With that out of the way, run the following script to initialize the storage system. You only need to do this once:
/opt/performa/bin/control.sh setup
Among other things, this creates an administrator user account you can use to login right away. The username is admin and the password is admin. It is recommended you change the password as soon as possible, for security purposes (or just create your own administrator account and delete admin).
At this point you should be able to start the service and access the web UI. Enter this command:
/opt/performa/bin/control.sh start
Then send your browser to the server on the correct port:
http://YOUR_SERVER_HOSTNAME:5511/
You only need to include the port number in the URL if you are using a non-standard HTTP port (see Web Server Configuration).
For monitoring multiple servers see Performa Satellite below.
Configuration
The main Performa configuration file is in JSON format, and can be found here:
/opt/performa/conf/config.json
Please edit this file directly. It will not be touched by any upgrades. A pristine copy of the default configuration can always be found here: /opt/performa/sample_conf/config.json.
Basics
Here are descriptions of the top-level configuration parameters:
base_app_url
This should be set to a fully-qualified URL, pointing to your Performa server, including the HTTP port number if non-standard. Do not include a trailing slash. This is used in e-mails to create self-referencing URLs. Example:
http://local.performa.com:3012
If you are running Performa behind a load balancer, this should be set to the load balanced virtual hostname.
email_from
The e-mail address to use as the "From" address when sending out notifications. Most SMTP servers require this to be a valid address to accept mail.
email_to
The default e-mail address (or addresses, comma-separated) to send all alert notifications to. This can be overridden at the group and alert level.
smtp_hostname
The hostname of your SMTP server, for sending mail. This can be set to 127.0.0.1 or localhost if you have sendmail running locally.
smtp_port
The port number to use when communicating with the SMTP server. The default is 25.
mail_options
Using this optional property you can set specific mailer options, such as SMTP SSL and authentication, which are passed directly to nodemailer. Example:
"mail_options": {
	"secure": true,
	"auth": { "user": "fsmith", "pass": "12345" },
	"connectionTimeout": 10000,
	"greetingTimeout": 10000,
	"socketTimeout": 10000
}
The connectionTimeout, greetingTimeout and socketTimeout properties are all expressed in milliseconds.
You can also use mail_options to use local sendmail, if you have that configured on your server. To do this, set the following properties, and tune as needed:
"mail_options": {
	"sendmail": true,
	"newline": "unix",
	"path": "/usr/sbin/sendmail"
}
You can omit smtp_hostname and smtp_port if you are using sendmail.
secret_key
For communicating with Performa Satellite, all your servers need to share the same secret key. This is used as a salt string to construct cryptographic authentication tokens, to securely send custom monitoring commands to be executed on your servers. When you install Satellite, you'll need to configure it with the same secret key as the master server.
The installer script will automatically set to this to a random string for you, but you are free to change it to anything you want. Just make sure all your servers have the same shared secret key.
log_dir
The directory where logs will be written, before they are archived. This can be a partial path, relative to the Performa base directory (/opt/performa) or a full path to a custom location. It defaults to logs (i.e. /opt/performa/logs).
log_filename
The filename to use when writing logs. You have three options here: a single combined log file for all logs, multiple log files for each component, or multiple log files for each category (debug, transaction, error). See the Logs section below for details.
log_columns
This is an array of column IDs to log. You are free to reorder or remove some of these, but do not change the names. They are specific IDs that match up to log function calls in the code. See the Logs section below for details.
log_archive_path
Every night at midnight (local server time), the logs can be archived (gzipped) to a separate location on disk. This parameter specifies the filesystem path, and the directory naming / filenaming convention of the archive files. It can utilize date placeholders including [yyyy], [mm] and [dd].
This can be a partial path, relative to the Performa base directory (/opt/performa) or a full path to a custom location. It defaults to logs/archives/[yyyy]/[mm]/[dd]/[filename]-[yyyy]-[mm]-[dd].log.gz.
log_archive_storage
As an alternative to archiving logs on disk via log_archive_path, you can instead archive them to your storage system. This makes sense when using an external storage provider with separate access to your files (like Amazon S3). To use this feature, add a log_archive_storage object with the following syntax:
"log_archive_storage": {
	"enabled": true,
	"key_template": "logs/archives/[yyyy]/[mm]/[dd]/[filename]-[yyyy]-[mm]-[dd].log.gz",
	"expiration": "1 year"
}
The enabled property controls whether the system is active or not. The key_template allows you to archive logs in custom location in your storage system. The expiration sets the expiration date for each log archive, relative to the current date.
Note that if log_archive_path is also set, it takes precedence over this.
debug_level
The level of verbosity in the debug logs. It ranges from 1 (very quiet) to 10 (extremely loud). The default value is 5.
Advanced Configuration
maintenance
Performa needs to run storage maintenance once per day, which generally involves deleting expired records and trimming lists which have grown too large. The application is still usable during this time, but UI performance may be slightly impacted.
By default the maintenance is set to run at 4:00 AM (local server time). Feel free to change this to a more convenient time for your server environment. The format of the parameter is HH:MM.
expiration
The expiration property sets the data expiration period for all server and group timeline data. It accepts any human-readable relative date string, e.g. 6 months or 10 years. Set this to false to disable expiration, meaning data will never be expired.
list_row_max
This parameter controls how many items are kept in historical lists such as the Activity Log and Snapshots. When this limit is exceeded, the oldest entries are removed during the nightly maintenance run. The default limit is 10000 items. Set this to false to disable expiration.
This has no real effect on performance -- only space on disk (or Couchbase / S3).
pid_file
The PID file is simply a text file containing the Process ID of the main Performa daemon. It is used by the control.sh script to stop the daemon, and detect if it is running. You should never have to deal with this file directly, and it defaults to living in the logs directory which is auto-created.
This can be a partial path, relative to the Performa base directory (/opt/performa) or a full path
编辑推荐精选


GPT Plus|Pro充值
GPT充值
支持 ChatGPT Plus / Pro 充值服务,支付便捷,自动发货,售后可查。


GPT Image 2中文站
AI 图片生成平台
GPT Image 2 是面向用户的 AI 图片生成平台,支持文生图、图生图及多模型创意工作流。


Vecbase
你的AI Agent团队
Vecbase 是专为 AI 团队打造的智能工作空间,将数据管理、模型协作与知识沉淀整合于一处。算法、产品与业务在同一平台无缝协同,让从数据到 AI 应用的落地更快一步。


音述AI
全球首个AI音乐社区
音述AI是全球首个AI音乐社区,致力让每个人都能用音乐表达自我。音述AI提供零门槛AI创作工具,独创GETI法则帮助用户精准定义音乐风格,AI润色功能支持自动优化作品质感。音述AI支持交流讨论、二次创作与价值变现。针对中文用户的语言习惯与文化背景进行专门优化,支持国风融合、C-pop等本土音乐标签,让技术更好地承载人文表达。


QoderWork
阿里Qoder团队推出的桌面端AI智能体
QoderWork 是阿里推出的本地优先桌面 AI 智能体,适配 macOS14+/Windows10+,以自然语言交互实现文件管理、数据分析、AI 视觉生成、浏览器自动化等办公任务,自主拆解执行复杂工作流,数据本地运行零上传,技能市场可无限扩展,是高效的 Agentic 生产力办公�助手。


lynote.ai
一站式搞定所有学习需求
不再被海量信息淹没,开始真正理解知识。Lynote 可摘要 YouTube 视频、PDF、文章等内容。即时创建笔记,检测 AI 内容并下载资料,将您的学习效率提升 10 倍。


AniShort
为AI短剧协作而生
专为AI短剧协作而生的AniShort正式发布,深度重构AI短剧全流程生产模式,整合创意策划、制作执行、实时协作、在线审片、资产复用等全链路功能,独创无限画布、双轨并行工业化工作流与Ani智能体助手,集成多款主流AI大模型,破解素材零散、版本混乱、沟通低效等行业痛点,助力3人团队效率提升800%,打造标准化、可追溯的AI短剧量产体系,是AI短剧团队协同创作、提升制作效率的核心工具。


seedancetwo2.0
能听懂你表达的视频模型
Seedance two是基于seedance2.0的中国大模型,支持图像、视频、音频、文本四种模态输入,表达方式更丰富,生成也更可控。


nano-banana纳米香蕉中文站
国内直接访问,限时3折
输入简单文字,生成想要的图片,纳米香蕉中文站基于 Google 模型的 AI 图片生成网站,支持文字生图、图生图。官网价格限时3折活动


扣子-AI办公
职场AI,就用扣子
AI办公助手,复杂任务高效处理。办公效率低?扣子空间AI助手支持播客生成、PPT制作、网页开发及报告写作,覆盖科研、商业、舆情等领域的专家Agent 7x24小时响应,生活工作无缝切换,提升50%效率!
推荐工具精选


AI云服务特惠
懂AI专属折扣关注微信公众号
最新AI工具、AI资讯
独家AI资源、AI项目落地

微信扫一扫关注公众号