


![]()


![]()

BenchmarkDotNet helps you to transform methods into benchmarks, track their performance, and share reproducible measurement experiments. It's no harder than writing unit tests! Under the hood, it performs a lot of magic that guarantees reliable and precise results thanks to the perfolizer statistical engine. BenchmarkDotNet protects you from popular benchmarking mistakes and warns you if something is wrong with your benchmark design or obtained measurements. The results are presented in a user-friendly form that highlights all the important facts about your experiment. BenchmarkDotNet is already adopted by 22000+ GitHub projects including .NET Runtime, .NET Compiler, .NET Performance, and many others.
It's easy to start writing benchmarks, check out the following example (copy-pastable version is here):
[SimpleJob(RuntimeMoniker.Net472, baseline: true)]
[SimpleJob(RuntimeMoniker.NetCoreApp30)]
[SimpleJob(RuntimeMoniker.NativeAot70)]
[SimpleJob(RuntimeMoniker.Mono)]
[RPlotExporter]
public class Md5VsSha256
{
    private SHA256 sha256 = SHA256.Create();
    private MD5 md5 = MD5.Create();
    private byte[] data;

    [Params(1000, 10000)]
    public int N;

    [GlobalSetup]
    public void Setup()
    {
        data = new byte[N];
        new Random(42).NextBytes(data);
    }

    [Benchmark]
    public byte[] Sha256() => sha256.ComputeHash(data);

    [Benchmark]
    public byte[] Md5() => md5.ComputeHash(data);
}
BenchmarkDotNet automatically runs the benchmarks on all the runtimes, aggregates the measurements, and prints a summary table with the most important information:
BenchmarkDotNet=v0.12.0, OS=Windows 10.0.17763.805 (1809/October2018Update/Redstone5)
Intel Core i7-7700K CPU 4.20GHz (Kaby Lake), 1 CPU, 8 logical and 4 physical cores
  [Host]       : .NET Framework 4.7.2 (4.7.3468.0), X64 RyuJIT
  Net472       : .NET Framework 4.7.2 (4.7.3468.0), X64 RyuJIT
  NetCoreApp30 : .NET Core 3.0.0 (CoreCLR 4.700.19.46205, CoreFX 4.700.19.46214), X64 RyuJIT
  NativeAot70  : .NET 7.0.0-preview.4.22172.7, X64 NativeAOT
  Mono         : Mono 6.4.0 (Visual Studio), X64


| Method |       Runtime |     N |       Mean |     Error |    StdDev | Ratio |
|------- |-------------- |------ |-----------:|----------:|----------:|------:|
| Sha256 |    .NET 4.7.2 |  1000 |   7.735 us | 0.1913 us | 0.4034 us |  1.00 |
| Sha256 | .NET Core 3.0 |  1000 |   3.989 us | 0.0796 us | 0.0745 us |  0.50 |
| Sha256 | NativeAOT 7.0 |  1000 |   4.091 us | 0.0811 us | 0.1562 us |  0.53 |
| Sha256 |          Mono |  1000 |  13.117 us | 0.2485 us | 0.5019 us |  1.70 |
|        |               |       |            |           |           |       |
|    Md5 |    .NET 4.7.2 |  1000 |   2.872 us | 0.0552 us | 0.0737 us |  1.00 |
|    Md5 | .NET Core 3.0 |  1000 |   1.848 us | 0.0348 us | 0.0326 us |  0.64 |
|    Md5 | NativeAOT 7.0 |  1000 |   1.817 us | 0.0359 us | 0.0427 us |  0.63 |
|    Md5 |          Mono |  1000 |   3.574 us | 0.0678 us | 0.0753 us |  1.24 |
|        |               |       |            |           |           |       |
| Sha256 |    .NET 4.7.2 | 10000 |  74.509 us | 1.5787 us | 4.6052 us |  1.00 |
| Sha256 | .NET Core 3.0 | 10000 |  36.049 us | 0.7151 us | 1.0025 us |  0.49 |
| Sha256 | NativeAOT 7.0 | 10000 |  36.253 us | 0.7076 us | 0.7571 us |  0.49 |
| Sha256 |          Mono | 10000 | 116.350 us | 2.2555 us | 3.0110 us |  1.58 |
|        |               |       |            |           |           |       |
|    Md5 |    .NET 4.7.2 | 10000 |  17.308 us | 0.3361 us | 0.4250 us |  1.00 |
|    Md5 | .NET Core 3.0 | 10000 |  15.726 us | 0.2064 us | 0.1930 us |  0.90 |
|    Md5 | NativeAOT 7.0 | 10000 |  15.627 us | 0.2631 us | 0.2461 us |  0.89 |
|    Md5 |          Mono | 10000 |  30.205 us | 0.5868 us | 0.6522 us |  1.74 |
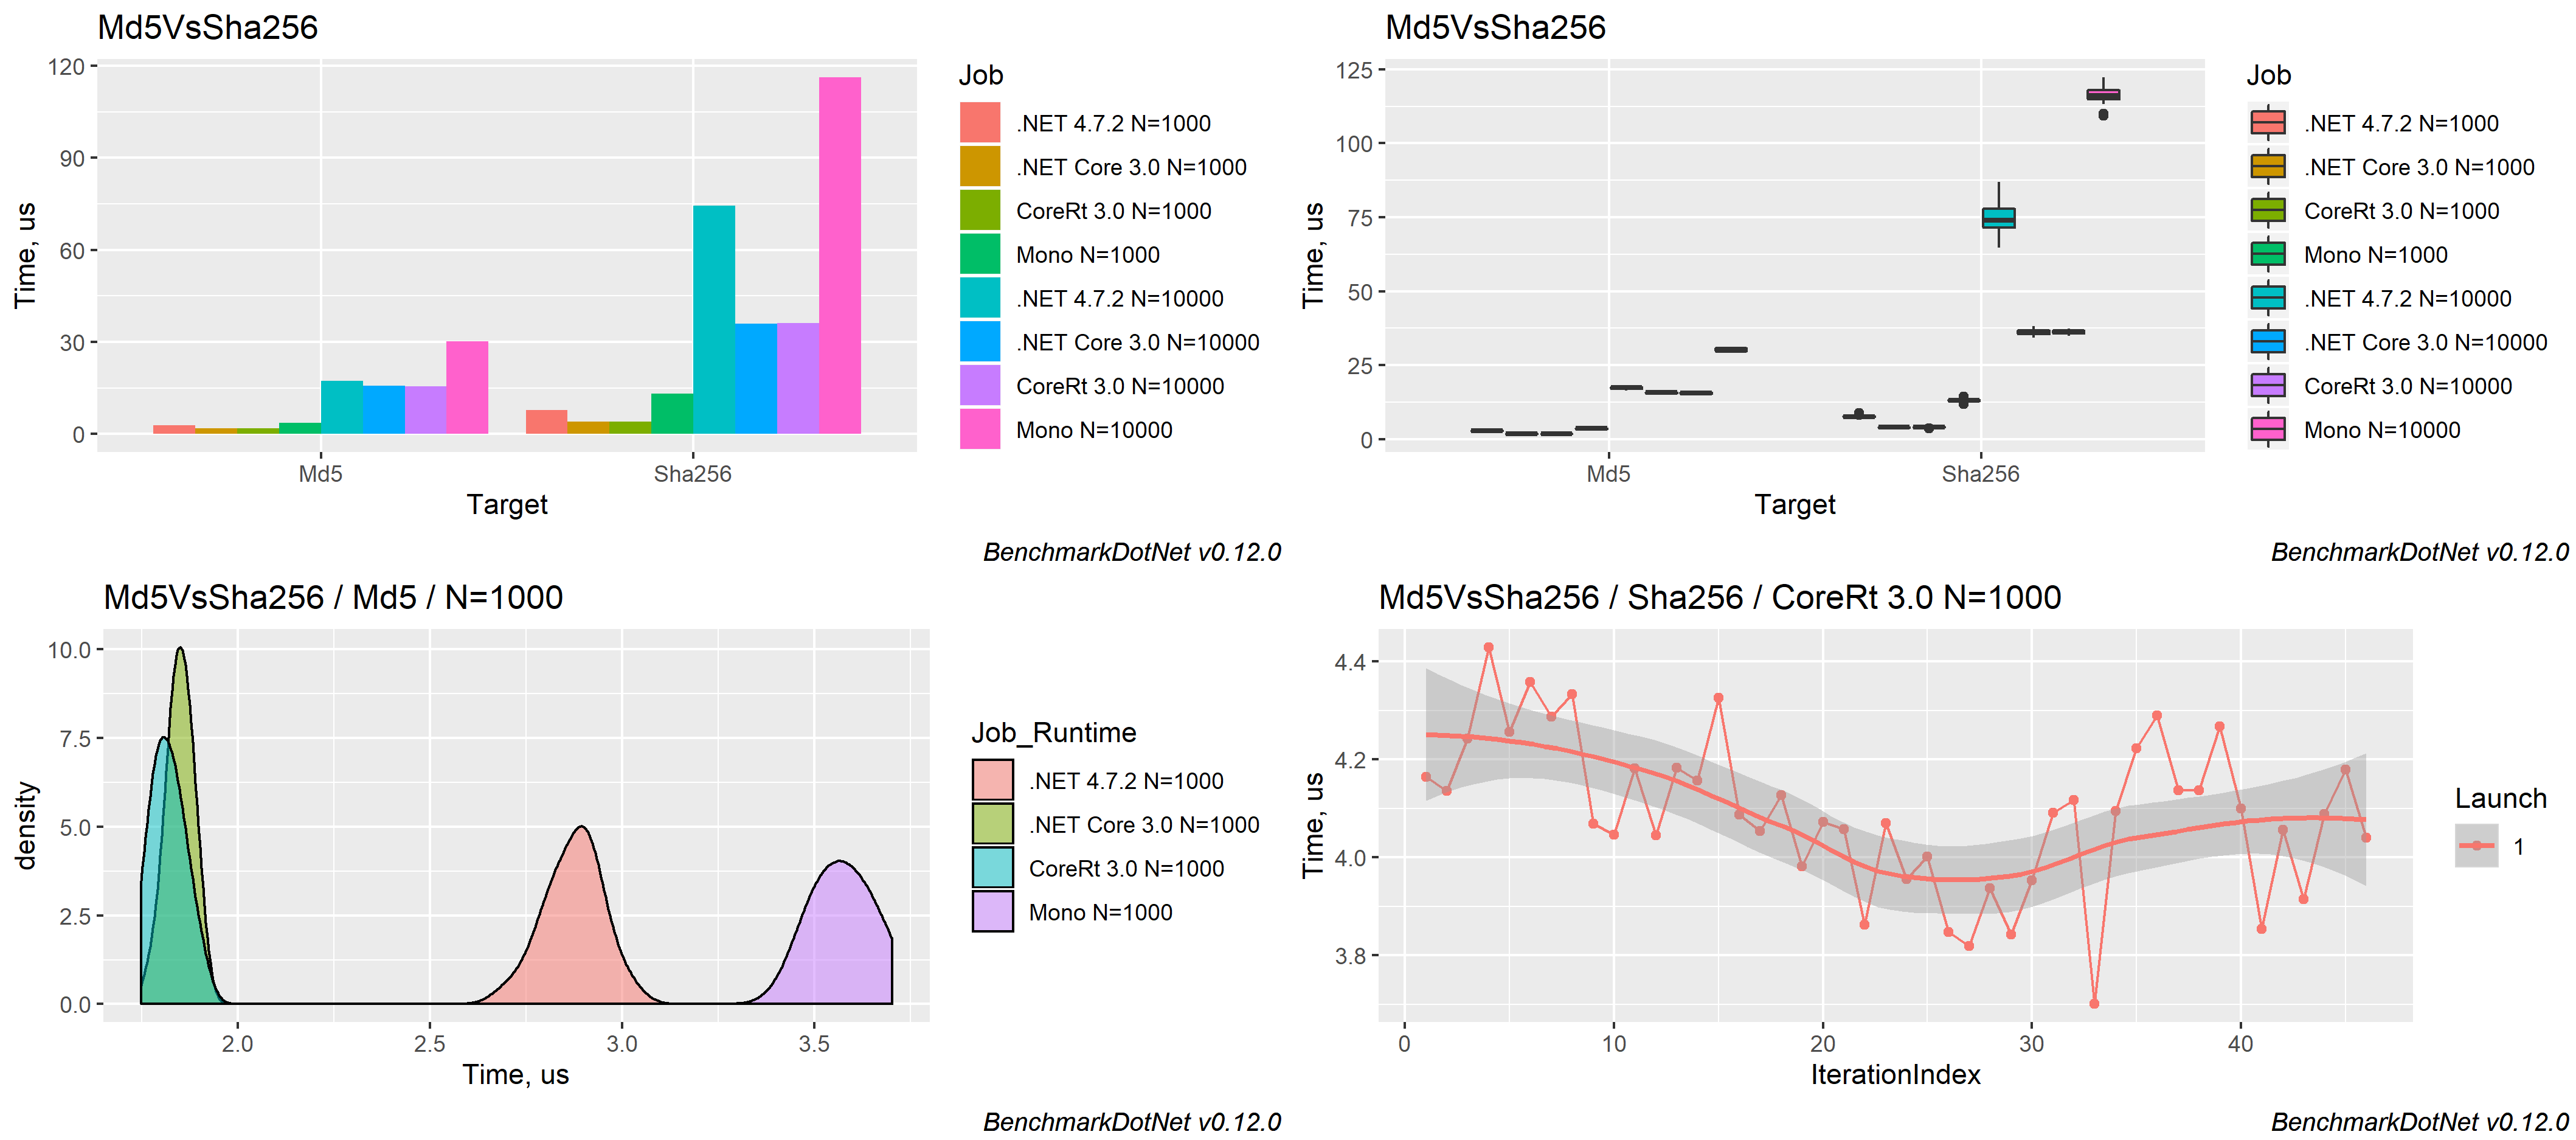
The measured data can be exported to different formats (md, html, csv, xml, json, etc.) including plots:
Supported runtimes: .NET 5+, .NET Framework 4.6.1+, .NET Core 2.0+, Mono, NativeAOT
Supported languages: C#, F#, Visual Basic
Supported OS: Windows, Linux, macOS
Supported architectures: x86, x64, ARM, ARM64, Wasm and LoongArch64
Features
BenchmarkDotNet has tons of features that are essential in comprehensive performance investigations. Four aspects define the design of these features: simplicity, automation, reliability, and friendliness.
Simplicity
You shouldn't have to be an experienced performance engineer if you want to write benchmarks. You can design very complicated performance experiments in the declarative style using simple APIs.
For example, if you want to parameterize your benchmark,
mark a field or a property with [Params(1, 2, 3)]: BenchmarkDotNet will enumerate all of the specified values
and run benchmarks for each case.
If you want to compare benchmarks with each other,
mark one of the benchmarks as the baseline
via [Benchmark(Baseline = true)]: BenchmarkDotNet will compare it with all of the other benchmarks.
If you want to compare performance in different environments, use jobs.
For example, you can run all the benchmarks on .NET Core 3.0 and Mono via
[SimpleJob(RuntimeMoniker.NetCoreApp30)] and [SimpleJob(RuntimeMoniker.Mono)].
If you don't like attributes, you can call most of the APIs via the fluent style and write code like this:
ManualConfig.CreateEmpty() // A configuration for our benchmarks
    .AddJob(Job.Default // Adding first job
        .WithRuntime(ClrRuntime.Net472) // .NET Framework 4.7.2
        .WithPlatform(Platform.X64) // Run as x64 application
        .WithJit(Jit.LegacyJit) // Use LegacyJIT instead of the default RyuJIT
        .WithGcServer(true) // Use Server GC
    ).AddJob(Job.Default // Adding second job
        .AsBaseline() // It will be marked as baseline
        .WithEnvironmentVariable("Key", "Value") // Setting an environment variable
        .WithWarmupCount(0) // Disable warm-up stage
    );
If you prefer command-line experience, you can configure your benchmarks via the console arguments in any console application (other types of applications are not supported).
Automation
Reliable benchmarks always include a lot of boilerplate code.
Let's think about what you should do in a typical case. First, you should perform a pilot experiment and determine the best number of method invocations. Next, you should execute several warm-up iterations and ensure that your benchmark achieved a steady state. After that, you should execute the main iterations and calculate some basic statistics. If you calculate some values in your benchmark, you should use it somehow to prevent dead code elimination. If you use loops, you should care about the effect of the loop unrolling on your results (which may depend on the processor architecture). Once you get results, you should check for some special properties of the obtained performance distribution like multimodality or extremely high outliers. You should also evaluate the overhead of your infrastructure and deduct it from your results. If you want to test several environments, you should perform the measurements in each of them and manually aggregate the results.
If you write this code from scratch, it's easy to make a mistake and spoil your measurements. Note that it's a shortened version of the full checklist that you should follow during benchmarking: there are a lot of additional hidden pitfalls that should be handled appropriately. Fortunately, you shouldn't worry about it because BenchmarkDotNet will perform this boring and time-consuming stuff for you.
Moreover, the library can help you with some advanced tasks that you may want to perform during the investigation. For example, BenchmarkDotNet can measure the managed and native memory traffic and print disassembly listings for your benchmarks.
Reliability
A lot of hand-written benchmarks produce wrong numbers that lead to incorrect business decisions. BenchmarkDotNet protects you from most of the benchmarking pitfalls and allows achieving high measurement precision.
You shouldn't worry about the perfect number of method invocation, the number of warm-up and actual iterations: BenchmarkDotNet tries to choose the best benchmarking parameters and achieve a good trade-off between the measurement prevision and the total duration of all benchmark runs. So, you shouldn't use any magic numbers (like "We should perform 100 iterations here"), the library will do it for you based on the values of statistical metrics.
BenchmarkDotNet also prevents benchmarking of non-optimized assemblies that were built using DEBUG mode because the corresponding results will be unreliable. The library will print a warning if you have an attached debugger, if you use a hypervisor (HyperV, VMware, VirtualBox), or if you have any other problems with the current environment.
During 6+ years of development, we faced dozens of different problems that may spoil your measurements. Inside BenchmarkDotNet, there are a lot of heuristics, checks, hacks, and tricks that help you to increase the reliability of the results.
Friendliness
Analysis of performance data is a time-consuming activity that requires attentiveness, knowledge, and experience. BenchmarkDotNet performs the main part of this analysis for you and presents results in a user-friendly form.
After the experiments, you get a summary table that contains a lot of useful data about the executed benchmarks. By default, it includes only the most important columns, but they can be easily customized. The column set is adaptive and depends on the benchmark definition and measured values. For example, if you mark one of the benchmarks as a baseline, you will get additional columns that will help you to compare all the benchmarks with the baseline. By default, it always shows the Mean column, but if we detected a vast difference between the Mean and the Median values, both columns will be presented.
BenchmarkDotNet tries to find some unusual properties of your performance distributions and prints nice messages about it.
For example, it will warn you in case of multimodal distribution or high outliers.
In this case, you can scroll the results up and check out ASCII-style histograms for each distribution
or generate beautiful png plots using [RPlotExporter].
BenchmarkDotNet doesn't overload you with data; it shows only the essential information depending on your results: it allows you to keep the summary small for primitive cases and extend it only for complicated cases. Of course, you can request any additional statistics and visualizations manually. If you don't customize the summary view, the default presentation will be as much user-friendly as possible. :)
Learn more about benchmarking
BenchmarkDotNet is not a silver bullet that magically makes all of your benchmarks correct and analyzes the measurements for you. Even if you use this library, you still should know how to design benchmark experiments and how to make correct conclusions based on the raw data. If you want to know more about benchmarking methodology and good practices, it's recommended to read a book by Andrey Akinshin (the BenchmarkDotNet project lead): "Pro .NET Benchmarking". Use this in-depth guide to correctly design benchmarks, measure key performance metrics of .NET applications, and analyze results. This book presents dozens of case studies to help you understand complicated benchmarking topics. You will avoid common pitfalls, control the accuracy of your measurements, and improve the performance of your software.
<div align="center"> <a href="https://aakinshin.net/prodotnetbenchmarking/"> <img src="https://aakinshin.net/img/misc/prodotnetbenchmarking-cover.png" width="400" /> </a> </div>Contributions are welcome!
BenchmarkDotNet is already a stable full-featured library that allows performing performance investigation on a professional level. And it continues to evolve! We add new features all the time, but we have too many new cool ideas. Any help will be appreciated. You can develop new features, fix bugs, improve the documentation, or do some other cool stuff.
If you want to contribute, check out the Contributing guide and up-for-grabs issues. If you have new ideas or want to complain about bugs, feel free to create a new issue. Let's build the best tool for benchmarking together!
Code of Conduct
This project has adopted the code of conduct defined by
编辑推荐精选


扣子-AI办公
职场AI,就用扣子
AI办公助手,复杂任务高效处理。办公效率低?扣子空间AI助手支持播客生成、PPT制作、网页开发及报告写作,覆盖科研、商业、舆情等领域的专家Agent 7x24小时响应,生活工作无缝切换,提升50%效率!


堆友
多风格AI绘画神器
堆友平台由阿里巴巴设计团队创建,作为一款AI驱动的设计工具,专为设计师提供一站式增长服务。功能覆盖海量3D素材、AI绘画、实时渲染以及专业抠图,显著提升设计品质和效率。平台不仅提供工具,还是一个促进创意交流和个人发展的空间,界面友好,适合所有级别的设计师和创意工作者。


码上飞
零代码AI应用开发平台
零代码AI应用开发平台,用户只需一句话简单描述需求,AI能自动生成小程序、APP或H5网页应用,无需编写代码。


Vora
免费创建高清无水印Sora视频
Vora是一个免费创建高清无水印Sora视频的AI工具


Refly.AI
最适合小白的AI自动化工作流平台
无需编码,轻松生成可复用、可变现的AI自动化工作流


酷表ChatExcel
大模型驱动的Excel数据处理工具
基于大模型交互的表格处理系统,允许用户通过对话方式完成数据整理和可视化分析。系统采用机器学习算法解析用户指令,自动执行排序、公式计算和数据透视等操作,支持多种文件格式导入导出。数据处理响应速度保持在0.8秒以内,支持超过100万行数据的即时分析。


TRAE编程
AI辅助编程,代码自动修复
Trae是一种自适应的集成开发环境(IDE),通过自动化和多元协作改变开发流程。利用Trae,团队能够更快速、精确地编写和部署代码,从而提高编程效率和项目交付速度。Trae具备上下文感知和代码自动完成功能,是提升开发效率的理想工具。


AIWritePaper论文写作
AI论文写作指导平台
AIWritePaper论文写作是一站式AI论文写作辅助工具,简化了选题、文献检索至论文撰写的整个过程。通过简单设定,平台可快速生成高质量论文大纲和全文,配合图表、参考文献等一应俱全,同时提供开题报告和答辩PPT等增值服务,保障数据安全,有效提升写作效率和论文质量。


博思AIPPT
AI一键生成PPT,就用博思AIPPT!
博思AIPPT,新一代的AI生成PPT平台,支持智能生成PPT、AI美化PPT、文本&链接生成PPT、导入Word/PDF/Markdown文档生成PPT等,内置海量精美PPT模板,涵盖商务、教育、科技等不同风格,同时针对每个页面提供多种版式,一键自适应切换,完美适配各种办公场景。


潮际好麦
AI赋能电商视觉革命,一站式智能商拍平台
潮际好麦深耕服装行业,是国内AI试衣效果最好的软件。使用先进AIGC能力为电商卖家批量提供优质的、低成本的商拍图。合作品牌有Shein、Lazada、安踏、百丽等65个国内外头部品牌,以及国内10万+淘宝、天猫、京东等主流平台的品牌商家,为卖家节省将近85%的出图成本,提升约3倍出图效率,让品牌能够快速上架。
推荐工具精选


AI云服务特惠
懂AI专属折扣关注微信公众号
最新AI工具、AI资讯
独家AI资源、AI项目落地

微信扫一扫关注公众号